Grid
The Grid shows the detailed results of the selected time-frame and filters

When using the Compare To functionality, the Grid will show the Up/Down trend information comparing the Compare to Period to the selected date range.

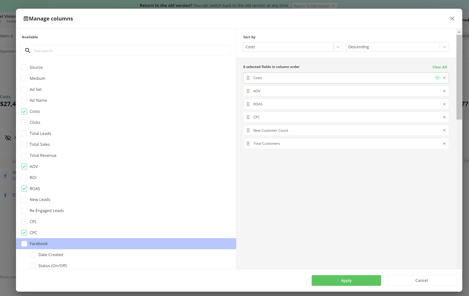
Columns can be hidden or shown and moved around using the Manage Columns button above the grid

Available Columns
- Channel Only in Overall Channel
- Campaign name Ad Campaign Name or utm_campaign value
- Intention to identify the purpose/goal of the campaign. Intention is a primary piece of the 5 Forces Methodology and 5 Forces AI system in Wicked Reports
- Source (hidden by default) Channel Name or utm_source value
- Medium (hidden by default) ppc or utm_medium value
- Ad Set / Ad Group/ Term (hidden by default) Facebook Ad Set Name, Google Ads Ad Group Name, etc or utm_term value
- Tracking Status attempts to determine based on your data if any of your Paid Channels have a Tracking Issue Lead Issue on a page associated with a row.
- Tracking Issue: This flag will be active if the following criteria is met
- Spend Yesterday > $50 AND
- Wicked Tracked Clicks = 0 AND
- Platform Reported Clicks > 5
- Tracking Issue: This flag will be active if the following criteria is met
-
- Lead Issue:
- Campaign Intention is "Generate New Leads" AND
- There are costs over the last 3 days AND
- There are no New Leads found from this row (without an order) over those 3 days
- OR
- Campaign Intention is "Re-Engage Existing Leads" AND
- There are costs over the last 3 days AND
- Therea re no Re-Engaged Leads attributed to this row over those 3 days
- Lead Issue:
- Issue Impact tells you what % of yesterday's costs make up the Tracking or Lead issue found on a row.
- Ad Name / Keyword / Content (hidden by default) Facebook Ad Name, Google Ads Keyword, etc or utm_content value
- Costs Total costs for the given row for the selected time frame and filters
- Clicks Total clicks for the given row for the selected time frame and filters
- New Visits Clicks for the selected time frame and filters are estimated to represent new visits to your site. Fundamentally, this estimation is based on the first clicks from unique IP addresses among all clicks.
- Example: If a user clicks on a Facebook Ad link (with URL Params) and it is the first time our system has tracked that IP address, then your Facebook Ad will get a +1 New Visit click on that day.
- There are some adjustments to this logic to increase the accuracy of the estimate.
-
- This metric is based purely on IP addresses. Email addresses are, in no way, considered in the calculation.
-
- This metric becomes more accurate as we gather more clicks over time. It is recommended to track for at least 14 days before making any adjustments to your budget based on the reported new visits.
- New Visit % Percentage of total clicks for the given row for the selected time frame and filters we have estimated to be New Visits to your site
- New Visits / Clicks
- eCPNV Estimated Cost Per New Visit for the given row for the selected time frame and filters
- Costs / New Visits
- Total Sales Total sales for the given row for the selected time frame and filters
- Total Sales = Total TOF Sales + Total MOF Sales + Total BOF Sales
- Clicking Total Sales will provide a popup of the Sales details filtered for All Sales
- nRevenue Revenue generated from only the first purchase of new customers for the given row for the selected time frame and filters
- rRevenue Revenue generated from repeat purchases for the given row for the selected time-frame and filters
- Total Revenue Total revenue for the given row for the selected time-frame and filters
- Total Revenue = Total TOF Revenue + Total MOF Revenue + Total BOF Revenue
- Hover Tool-tip will provide a breakdown of One-Time revenue, New Subscription revenue and Recurring Subscription revenue
- New Visits to New Customers Conv. Rate Conversion rate of New Visits to New Customers
- New Visits to New Customers Conv. Rate = New Customers / New Visits
- New Leads to New Customers Conv. Rate Conversion rate of New Leads to New Customers
- Based on the selected date range, what % of the New Leads actually became New Customers during the same date range.
- Clicks to Customers Conv. Rate Conversion rate of Clicks to Customers (new and repeat)
- Clicks to Customers Conv. Rate = Total Customers / Clicks
- Clicks to New Customers Conv. Rate Conversion rate of Clicks to New Customers
- Clicks to New Customers Conv. Rate = New Customers / Clicks
- nAOV Average Order Value from only the first purchase of new customers for the given row for the selected time-frame and filters
- rAOV Average Order Value from repeat purchases for the given row for the selected time-frame and filters
- AOV Average Order Value of all orders for the given row for the selected time-frame and filters
- ROI ROI for the given row for the selected time-frame and filters
- (Total Revenue - Costs) / Costs
- ROAS ROAS for the given row for the selected time-frame and filters
- Total Revenue / Costs
- New Leads New leads acquired for the given row for the selected time-frame and filters
- Clicking New Leads will provide a popup of the Leads details filtered for New Leads
- Re-Engaged Leads Re-Engaged leads for the given row for the selected time-frame and filters
- Clicking Re-Engaged Leads will provide a popup of the Leads details filtered for Re-Engaged
- Total Leads Total Leads for the given row for the selected time-frame and filters
- New Leads + Re-Engaged Leads
- Clicking Total Leads will provide a popup of the Leads details filtered for All Leads
- CPL Costs per New Lead for the given row for the selected time-frame and filters
- Costs / New Leads
- CPC Costs per click for the given row for the selected time-frame and filters
- Costs / Clicks
- Facebook Columns
When in the Facebook Channel, these Facebook fields are available in the grid
for Facebook data through yesterday

-
- Date Created The Date when this campaign, ad set or ad was newly created
- Status (On/Off) The current Status of the Ad/Ad Set/Campaign you are looking at.
- The Status is updated every hour.
- Website adds to cart The number of add to cart events tracked by the pixel or Conversions API on your website and attributed to your ads.
- Note: In some cases, this metric may be estimated
- Meta Add to Cart The number of add to cart actions within Meta technologies (such as Pages or Messenger) and attributed to your ads.
- Cost per add to Cart The average cost of each add to cart
- Note: In some cases, this metric may be estimated and reported by a third-party API
- Website Purchases The number of purchases events tracked by the pixel or Conversion API on your website and attributed to your ads
- Note: In some cases, this metric may be estimated
- Website Purchase Conversion Value The total value of website purchases conversions
- Note: In some cases, this metric may be estimated
- Meta Purchases The number of purchases made within Meta technologies (such as Pages or Messenger) and attributed to your ads
- Meta purchase conversion value The total value of purchase conversions on Meta technologies
- Website Purchase ROAS The total return on ad spend (ROAS) from purchases on your website
- Note: In some cases, this metric may be estimated
- Impressions The number of times your ads were on screen
- CPM The average cost for 1,000 impressions
- Outbound Clicks The number of clicks on links that take people off Meta technologies
- Outbound Click Through Rate The percentage of times people saw your ad and performed an outbound click
- Cost Per Outbound Click The average cost per outbound click
- Top Of Funnel
- Total TOF Sales Total attributed sales to the Top Of Funnel for the given row for the selected time-frame and filters
- Total TOF Revenue Total attributed revenue to the Top Of Funnel for the given row for the selected time-frame and filters
- ROI TOF ROI for the given row for the selected time-frame and filters
- (Total TOF Revenue - Costs) / Costs
- ROAS TOF ROAS for the given row for the selected time-frame and filters
- Total TOF Revenue / Costs
- Middle Of Funnel
- Total MOF Sales Total attributed sales to the Middle Of Funnel for the given row for the selected time-frame and filters
- Total MOF Revenue Total attributed revenue to the Top Of Funnel for the given row for the selected time-frame and filters
- ROI MOF ROI for the given row for the selected time-frame and filters
- (Total MOF Revenue - Costs) / Costs
- ROAS MOF ROAS for the given row for the selected time-frame and filters
- Total MOF Revenue / Costs
- Bottom Of Funnel
- BOF Sales attributed sales to the Bottom Of Funnel for the given row for the selected time-frame and filters
- BOF Revenue attributed revenue to the Bottom Of Funnel for the given row for the selected time-frame and filters
- FB View-Through Conversions Facebook View-Through Conversions for the given row for the selected time-frame and filters (multiplied by the Facebook View-Through Confidence Score)
- FB View-Through Revenue Facebook View-Through Conversion Revenue for the given row for the selected time-frame and filters (multiplied by the Facebook View-Through Confidence Score)
- Total BOF Sales Total BOF Sales for the given row for the selected time-frame and filters
- BOF Sales + Facebook View-Through Conversions
- Total BOF Revenue Total BOF Revenue for the given row for the selected time-frame and filters
- BOF Revenue + Facebook View-Through Revenue
- ROI BOF ROI for the given row for the selected time-frame and filters
- (Total BOF Revenue - Costs) / Costs
- ROAS BOF ROAS for the given row for the selected time-frame and filters
- Total BOF Revenue / Costs
- New Customer Count count of New Customers from the sales for the given row for the selected time-frame and filters
- Clicking New Customer Count will provide a popup of the Customer details filtered for New Customers
- Repeat Customer Count count of Repeat Customers from the sales for the given row for the selected time-frame and filters
- Clicking Repeat Customer Count will provide a popup of the Customer details filtered for Repeat Customers
- Total Customers count of all customers from the sales for the given row for the selected time-frame and filters
- New Customer Count + Repeat Customer Count
- Clicking Total Customer will provide a popup of the Customer details filtered for All Customers
- nCAC cost to acquire new customers for the given row for the selected time-frame and filters
- Costs / New Customer Count
- aCAC cost to acquire all customers for the given row for the selected time-frame and filters
- Costs / Total Customer Count
- aLTV Avg. Lifetime value of all customers from the sales for the given row for the selected time-frame and filters
- we take all the customers based on filter criteria and get their lifetime values and then provide the avg. of those values.
- nLTV Avg. Lifetime value of NEW customers from the sales for the given row for the selected time-frame and filters
- we take the new customers based on filter criteria and get their lifetime values and then provide the avg. of those values.
- EPC Earning Per Click for the given row for the selected time-frame and filters
- Total Revenue / Clicks
- EPL Earning Per New Lead for the given row for the selected time-frame and filters
- Total Revenue / New Leads
- First Click Date Earliest date a tracked click was recorded for the given row for the selected time-frame and filters
- Last Click Date Most recent date a tracked click was recorded for the given row for the selected time-frame and filters
- One-Time Sales count of one-time sales for the given row for the selected time-frame and filters
- Clicking One-Time Sales will provide a popup of the Sales details filtered for One-Time Sales
- New Subscription Sales count of new subscription sales for the given row for the selected time-frame and filters
- Clicking New Subscription Sales will provide a popup of the Sales details filtered for Subscription Sales
- Recurring Subscription Sales count of recurring subscription sales for the given row for the selected time-frame and filters
- Clicking Recurring Subscription Sales will provide a popup of the Sales details filtered for Subscription Sales
Wicked Tools Options
Every row in the FunnelVision Grid has 3 dots which are the Wicked Tools options
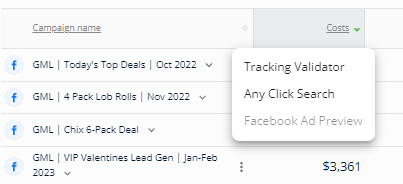
- Tracking Validator Tool to validate the URLs found for the selected row
- Any Click Search Opens the Customer LTV report using Any Click search for the selected Row
- Answers the question: "Find me all sales where this row was clicked anytime prior to a sale"
- Facebook Ad Preview When looking at Facebook Ad Rows, this will show you the most recent ad creative for the given Facebook Ad
FAQ:
- Q: My New Visit % is lower than expected. Why?
A: The New Visits % is based on unique IP addresses that we've identified in your account.- Reason #1: If you have a long standing account, then that means we'll have generated a significant amount of unique IP addresses for this metric - leading to a lower than expected New Visit %.
- Reason #2: If your Facebook Ad-set is not excluding website visitors for the past 180 days, then that could result in a lower New Visits %.
- Reason #3: If your Facebook Ad-Set has the Advantage Plus Audience setting turned on, then that setting, which uses AI to target people on Facebook, could override your exclusions and result in a lower New Visits %.