How to compare data from two periods
Learn how to compare FunnelVision data from one date range to another
Steps to Compare Two Periods
The FunnelVision report allows you to compare data from two different date ranges.
1. Select a Date Range
2. Toggle ON Compare
3. Select a Compare period prior to the Date Range and Apply Filters


STATIC Date Range
- Between is a static date range that will always be the same, no matter what day you run the report.
DYNAMIC Date Range
- Within Last will always use the current date for running the report.
- Example: Show me data within the last 30 days will always be with the last 30 days from the current day.
- Previous will always use a date range prior to the selected date range.
- Example: Show me a 7-day window, prior to the selected date range
- Same Period Previous Year will always use a the exact same date range, but one year prior to the selected Date Range.
- Example: Show me Oct. 1-31 2023 compared to Oct 1-31 2022
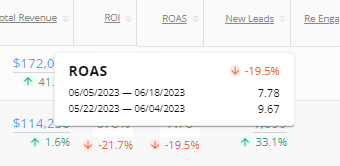
4. FunnelVision Summary data points will now include a Percent (%) change (from the Compare to Period) with an Up/Down arrow to show the change

5. All columns in the Grid will now include a Percent (%) change (from the Compare to Period) with an Up/Down arrow to show the change

6. Hover over any of the trend data points in the summary or grid to see the details of the comparison
