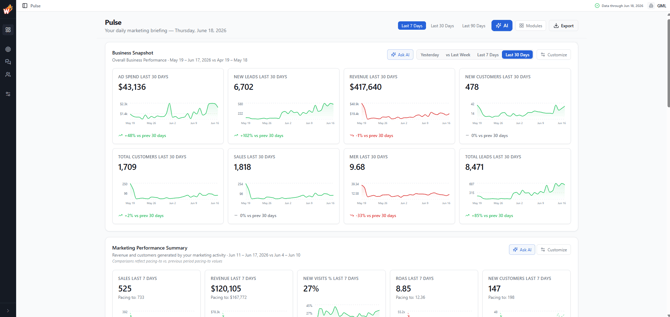
Instead of analyzing dozens of campaigns, reports, and metrics separately, Pulse brings together the most important business and marketing insights into a single view. It helps you quickly understand:
- How your business is performing
- How your marketing investments are performing
- Which channels are driving results
- What opportunities or risks require attention
Pulse is designed to answer the question:
"What happened, why did it happen, and what should I look at next?"
Why Use Pulse?
Marketing data is often spread across multiple reports and platforms.
Pulse consolidates your most important metrics into a single dashboard so you can:
- Monitor overall business performance
- Evaluate marketing effectiveness
- Identify top-performing channels
- Spot emerging trends and problems
- Discover opportunities through AI-generated insights
Whether you're a business owner, marketing director, or media buyer, Pulse helps you quickly understand what matters most without digging through multiple reports.
Understanding Pulse
Pulse consists of four primary modules:
- Business Snapshot
- Marketing Performance Summary
- Channel Performance
- What We're Seeing
Each module answers a different question.
Business Snapshot
Answers "How is my business performing?"
Business Snapshot provides a high-level view of your business results during the selected date range.
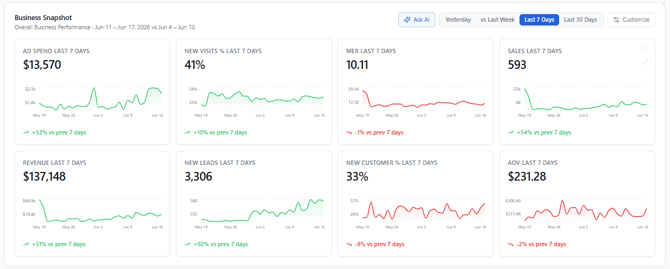
Metrics Included
Depending on your account configuration, Business Snapshot may include metrics such as:
- Ad Spend
- New Visits
- New Visits%
- New Leads
- New Leads %
- Sales
- Revenue
- Orders
- New Customers
- Repeat Customers
- Total Customers
- New Customer %
- Average Order Value (AOV)
- Marketing Efficiency Ratio (MER)
How It Works
Business Snapshot uses actual business outcomes that occurred during the selected date range.
This module is designed to provide a clear view of overall business performance rather than the performance of marketing channels.
When To Use It
Use Business Snapshot when you want to:
- Measure overall business growth
- Evaluate revenue trends
- Monitor customer acquisition
- Compare business performance across periods
Marketing Performance Summary
Answers "How effectively is my marketing generating results?"
Marketing Performance Summary focuses specifically on marketing performance.
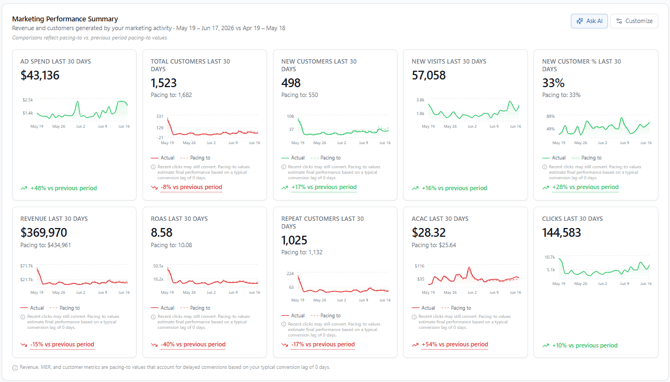
Metrics Included
Common metrics include:
- Ad Spend
- aCAC
- AOV
- Clicks
- Total Customers
- nCAC
- New Customers
- New Customer %
- New Visits
- New Visits %
- Repeat Cutomers
- ROAS
- Revenue
- Sales
How It Works
Marketing Performance Summary evaluates the performance of your marketing investments and attributes results back to the marketing activities that generated them.
Because customers often purchase days or weeks after first engaging with marketing, Wicked Reports applies its attribution methodology and lag modeling to provide a more complete view of marketing performance.
When To Use It
Use this module when you want to:
- Evaluate marketing ROAS
- Monitor acquisition efficiency
- Measure marketing-driven revenue
- Track overall channel effectiveness
Channel Performance
Answers "Which marketing channels are performing best?"Channel Performance compares the effectiveness of each marketing channel.
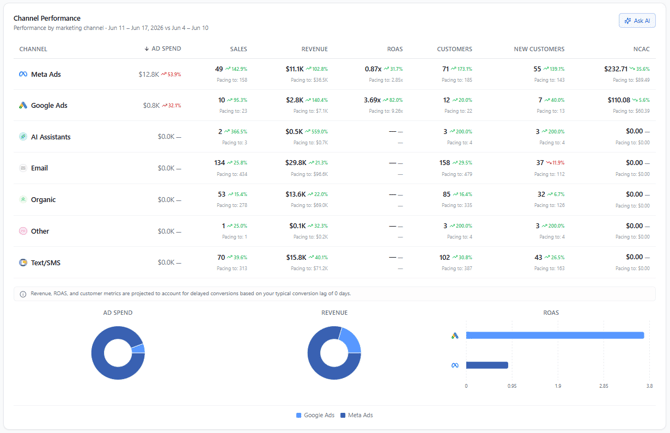
Metrics Included
Depending on your configuration, Channel Performance may display:
- Ad Spend
- Sales
- Revenue
- ROAS
- Customers
- New Customers
- nCAC
How It Works
Each row represents a marketing channel.
Examples include:
- Meta
- Google Ads
- YouTube Ads
- SMS
- Influencers
- Organic
- AI Assistants
- Other
The table allows you to compare how efficiently each channel contributes to business growth.
When To Use It
Use Channel Performance to:
- Identify winning channels
- Find underperforming investments
- Reallocate marketing budget
- Evaluate channel-level efficiency
What We're Seeing
Answers "What should I pay attention to right now?"
What We're Seeing is an AI-powered insights module that automatically analyzes your marketing and business performance.
 How It Works
The system continuously evaluates:
- Revenue trends
- Marketing efficiency
- Customer acquisition performance
- Channel performance
- Spending patterns
- Emerging opportunities
- Potential risks
When significant patterns are detected, Pulse generates actionable insights and watchouts.
Examples may include:
- A channel significantly outperforming historical trends
- Rising acquisition costs
- Improving ROAS
- Declining new customer growth
- Changes in channel contribution
Insight Confidence
Insights are generated using data-driven analysis and are prioritized based on their estimated business impact.
When To Use It
Review this module first when opening Pulse.
It is designed to quickly surface the most important changes in your business so you know where to focus your attention.
AI Assistant
Pulse includes an integrated AI assistant that can help you better understand your performance.
The AI assistant can answer questions such as:
- Why did revenue increase this week?
- Which channels generated the most new customers?
- What changed compared to last period?
- Why did ROAS decrease?
- Which channels should I investigate further?
The assistant uses the data currently displayed in Pulse to provide context-aware answers and recommendations.
Tips
Ask specific questions whenever possible.
Examples:
✅ "Why is Meta revenue down compared to last week?"
✅ "What drove the increase in new customers?"
✅ "Which channel has the strongest ROAS trend?"
Frequently Asked Questions
Why don't my numbers exactly match advertising platforms?
Advertising platforms use their own attribution models and reporting methodologies.
Pulse uses Wicked Reports attribution to provide a consistent view of marketing performance across all channels. The default attribution model used is U-Shpaed (40%, 20%, 40%) of sales directly attributed to clicks in the selected date range.
Why does Marketing Performance differ from Business Snapshot?Business Snapshot focuses on overall business outcomes.
Marketing Performance focuses on attributing those outcomes back to marketing activities.
Because these modules answer different questions, values may differ.
Why do channel totals change over time?Customers often purchase days or weeks after first engaging with marketing.
As additional purchase data becomes available, attributed performance may change.
How often is Pulse updated?Pulse updates daily as new marketing and order data become available in your account.
Which module should I look at first?Start with:
- What We're Seeing
- Business Snapshot
- Marketing Performance Summary
- Channel Performance
This workflow helps you quickly identify important changes before drilling into specific channels.
Can I use Pulse to make budget decisions?Yes.
Pulse is specifically designed to help identify:
- High-performing channels
- Underperforming channels
- Acquisition trends
- Marketing efficiency opportunities
For deeper analysis, use the Attribution Report after identifying an area of interest within Pulse.