4. How to Review Live Data from Zapier
5. FAQ
c. What if my payment software is not listed as an app in Zapier?
d. How to import historic orders
About this Setup
Connecting your payment software to Wicked Reports via Zapier allows Wicked Reports to track your orders just like any of our native integrations. Below, we walk you through the integration steps & best practices.
Connecting to Zapier
- If you have not connected your Wicked Reports account to Zapier yet, follow these instructions first: Integrating with Zapier
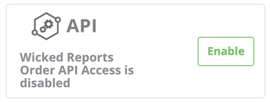
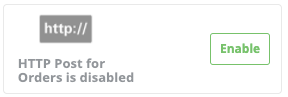
- If you have connected Wicked Reports to Zapier already, take a moment to ensure you have API for Orders and HTTP Post for Orders enabled under Setup > Authorizations tab > the Order Data column
Integration Steps
Integrating your payment software with Wicked Reports requires two simple steps:
Step #1 - Set up your trigger (Payment Software)
Step #2 - Set up your action (Wicked Reports)
Integration Step #1 - Set up your trigger (Payment Software)
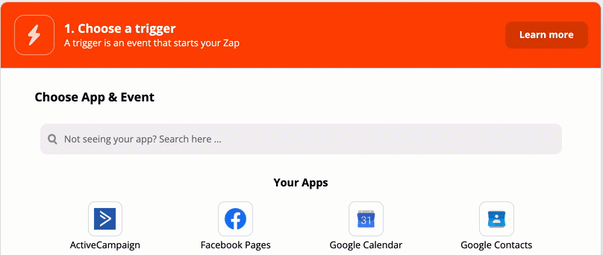
- Log in to Zapier and select, New Zap

- Type in the name of your payment software and select the app. This is an example:
- Choose the Event that best fits your needs.
- Typically, the event will be titled: "New Payment", "New Invoice", or similar.
- If you have questions on which event to select, start by selecting the event you believe to be most appropriate. In the Test Trigger step below, Zapier will reveal the data that pulls from this trigger to ensure you have the required data for Integration Step #2.
- Select your account (or add a new account). Once complete, press continue
- Select Test Trigger, then press continue
Integration Step #2 - Set up your action (Wicked Reports)
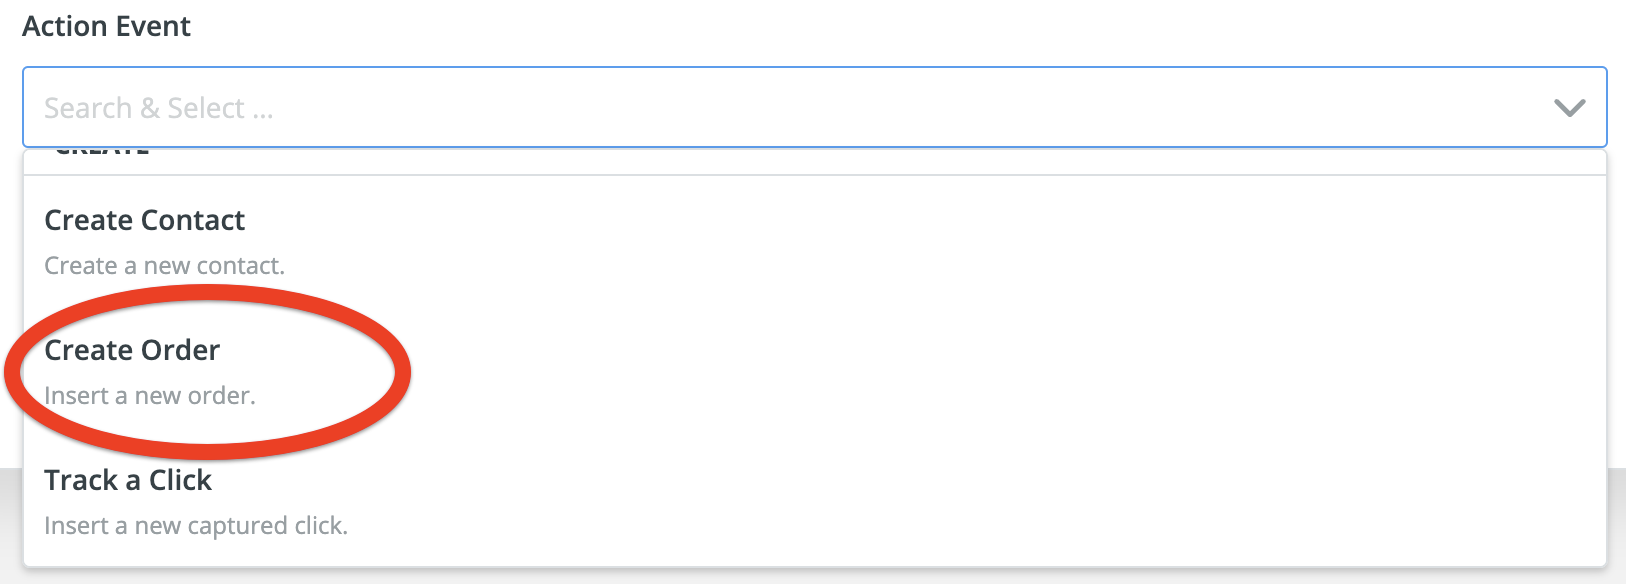
- Type in and select Wicked Reports as your app

- Select Create Order as your event option, then press continue
- Select your account, then press continue

- Customize the Order with these required fields. Once complete, press continue
- Source System - a good example is: Zapier-<YourOrderSystemName>. This way, when troubleshooting, your team & ours will know the data is coming from Zapier and which order system the data is sending from
- Customer Email - this should be available via the dropdown options
- Order ID - this should be available via the dropdown options, though can be any UNIQUE value
- Order Total - this should be available via the dropdown options
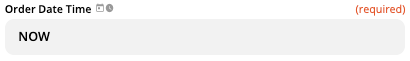
- Order Date Time - Type in the word, NOW
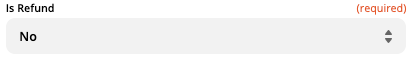
- Refund - Must be formatted as Yes or No
- Order Time Zone* - Required if you do not use NOW as the Order Date Time. This must be in UTC format and match the UTC timezone of your source system (e.g. If Easter Standard Time, then use UTC-5). You must update this field as timezones change with Daylight Savings. For example, EST (Eastern Standard Time) is UTC-5 part of the year and UTC-4 part of the year.
- SubscriptionID* - Required for subscription orders. How does Wicked handle subscriptions?
- Product ID* - Required if you want your products to populate in our Product Report
Note: Only one product ID can be used per unique order. Read more here. - Product Name* - Required if you want your products to populate in our Product Report
Note: Only one product Name can be used per unique order. Read more here.
- After completing the steps above, select Test & Review

This sends a test to Wicked Reports. To review your test, go to API & Uploaders > API Verification. Then, filter by TEST and the email address used in your Zapier test. If the data displays, you ran a successful test! (If you do not see your data, please note that our API verification page updates every ~30min)
- After testing, turn on your Zap. Review your data over the next few days to make sure you're getting the attribution you expect. For tips on How to Review Live Data from Zapier (not test data), continue scrolling.
How to Review Live Data from Zapier (not test data)
After turning your your zap on, it's important to review real submissions over the next few days to make sure you're getting the attribution you expect.
Here are the steps:
- Go to your zap's Task History
- Find an order that occurred one or more days in the past and copy the email address of that submission
- Inside Wicked Reports, paste the email address into the Customer LTV Report with the following filters:
- Date Range: Since First Tracking
- De-select, "Show ONLY Attributed Orders"
- Make sure you are on the Order/UTMSEARCH tab
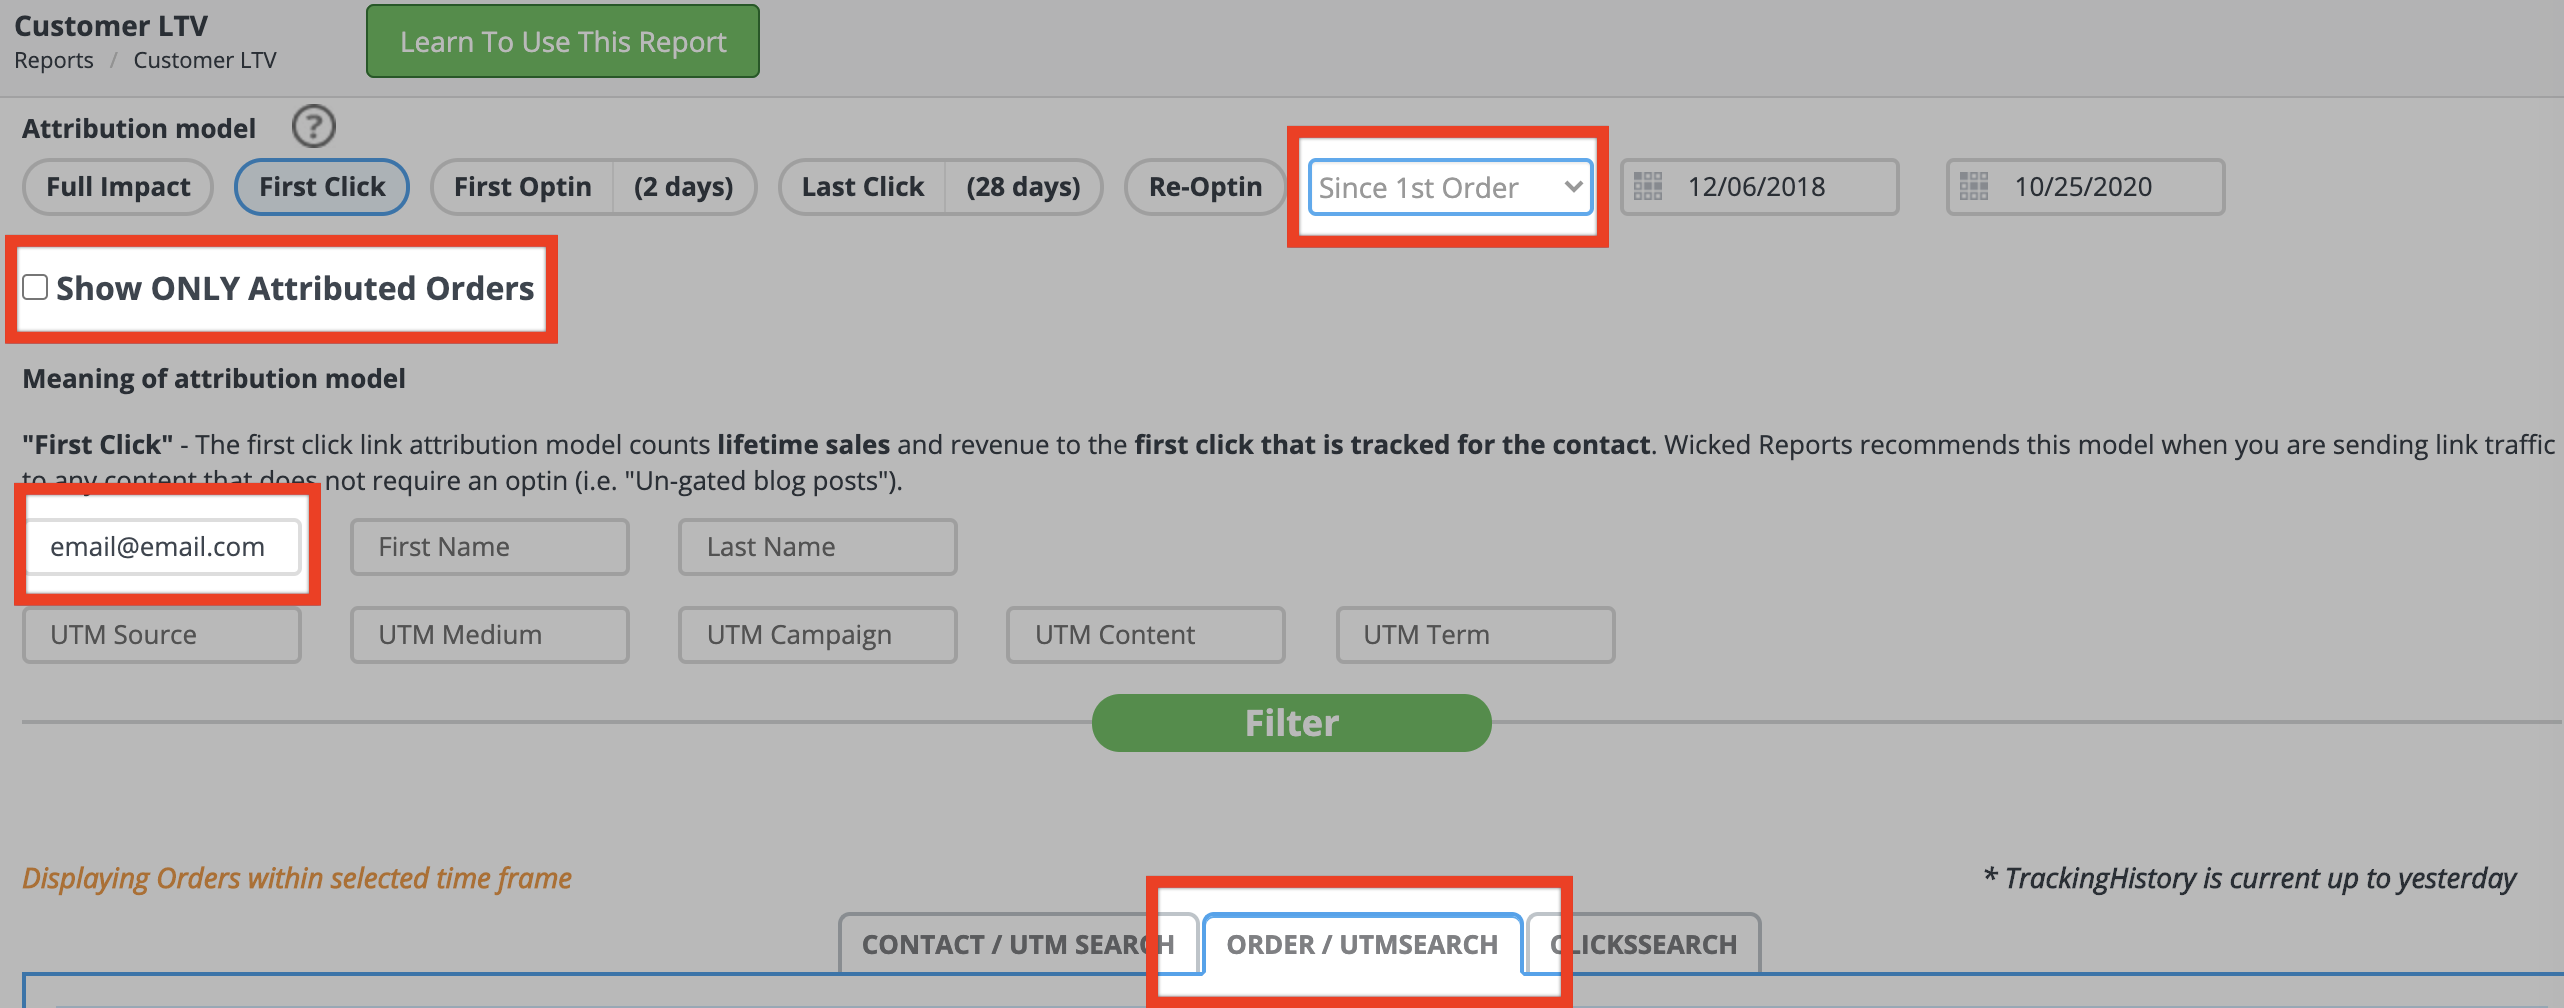
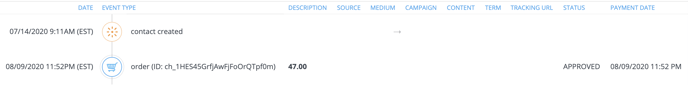
- Select Filter and then click on the record to open their contact profile
- A successful order displays at least two customer journey points inside the contact's Wicked Reports profile: Contact Created & the Order
FAQ
Tips on processing refunds
Since the Refund field in Integration Step #2 needs to be in a Yes or No format, there are a few ways you can make this happen:
- Formatter by Zapier
In order to use this feature, the data from your payment software must contain a field that indicates whether the order is a refund or not (e.g. TransactionStatus). If this is true, then you may use the Formatter > Utilities > Lookup Table function within the Formatter tool to replace the original value for this field with the value of "Yes" or "No".
This is an example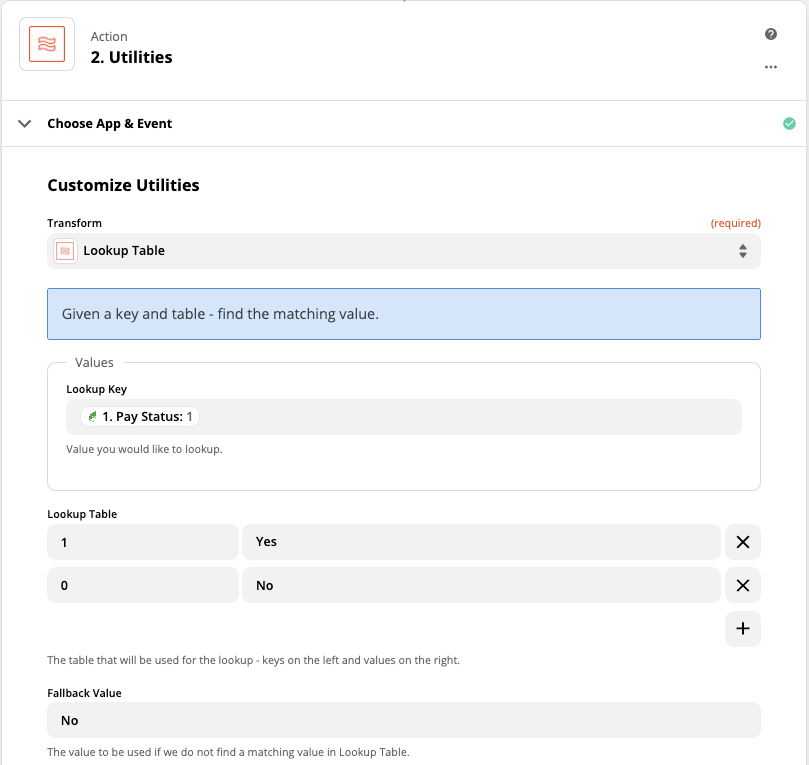
- Paths by Zapier
In order to use this feature, the data from your payment software must contain a field that indicates whether the order is a refund or not (e.g. TransactionStatus). If this is true, then you may use Paths by Zapier to route your integration accordingly. If the Transaction Status is Refund, then send the order down the Refund Path. The Refund Path will have Yes written in the Refund field for Integration Step #2. Create a similar path for successful payments where the Refund field is No.
This is an example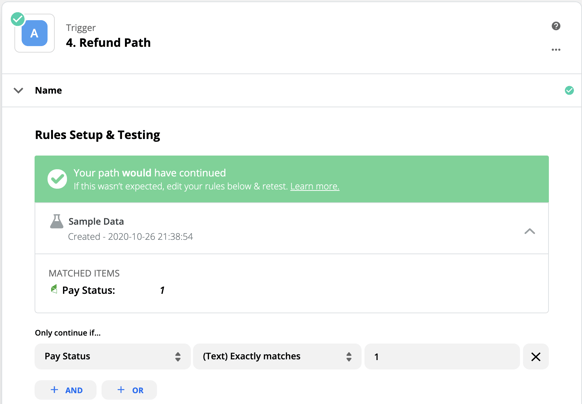
- Separate Zaps with separate triggers
Other times, your payment software may have a different trigger for each Transaction Status. If this is the case for you, then you will create two separate zaps - one triggered by refunds, one by successful payments. For the refund zap, you will simply type in Yes into the refund field located in Integration Step #2. For your payment Zap, you will write No into the refund field.
This is an example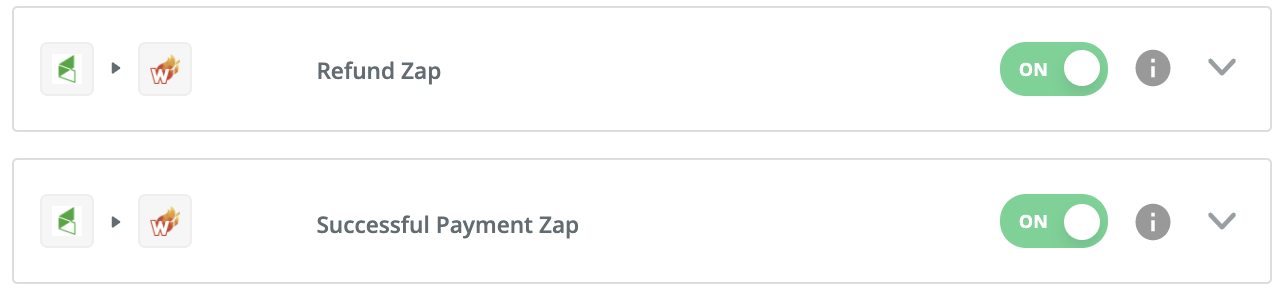
Tips on failed payments
When creating Orders via Zapier, it is best to filter out failed payments from the Zap. Doing so keeps your Revenue and Sales Counts accurate by ensuring failed payments are not treated as successful ones.
To filter out failed payments, the data from your payment software must contain a field that indicates whether the order is a failed payment or not (e.g. TransactionStatus). If this is true, then add a Filter by Zapier action after Integration Step #1 and before Integration Step #2 to filter out failed payments.
What if my payment software is not listed as an app in Zapier?
No worries. There are a few options you can use as an alternative trigger for your zap:
- Webhooks by Zapier
Occasionally, payment softwares offer webhooks. These webhooks fire off based on different transaction types and can be captured by Zapier using the Catch Hook function. The Catch Hook function will thereby be your trigger. - Email Parser by Zapier
For this to work, your payment software must have the ability to send the data that is required in Integration Step #2 to an email inbox of your choice. As the emails are sent, Zapier will parse the email just as if your payment software was natively integrated with Zapier. - Googlesheets, Quickbooks Online, or another app available on Zapier
In certain situations, your payment software may have a native integration with another app like Googlesheets or Quickbooks Online that does have an integration with Zapier. In this case, your payment software will send the data to the available app, and the available app will become your trigger instead. - HTTP Posts directly from the payment software
If your payment software has HTTP Post functionality built directly into its software, then you may use HTTP Posts to create custom orders. - Custom API
You may also consider building an integration directly to Wicked Reports via our API. - CSV Upload
You may also upload orders via a CSV upload
How to import historic orders
We strongly recommend importing historic orders - Importing historic orders allows your account to calculate the true LTV of your customers, whether the customer is new or repeat (especially important for recurring subscriptions), and allows you to use the Cohort Report & Predictive Behaviors report as soon as you get started. Our native integrations import historic orders automatically, so this gives you an experience most similar to them.
To import historic orders, manually upload the orders via a CSV. Learn how to manually upload orders via a CSV.