- Introduction to the Google Looker Studio Connector
- How To Connect Google Looker Studio to Wicked Reports
- FAQ
- Troubleshooting
Introduction to the Google Looker Studio Connector
Wicked Reports has a Google Looker Studio connector! This connector can pull your data from any "View" built within FunnelVision. Once your connector has been set up, you can slice and dice this data however you like within whatever date ranges you prefer.

Key Use Cases:
- Custom Reports
"I want my data to look like X" - Consolidating data sources into a single dashboard that rules them all
"I use multiple reporting software to make decisions" - Access control / User Permissions
"I want to show/hide information to different users" - Use Gemini for Looker Studio to enable AI Insights
"I want AI to help me analyze my data" - For Agencies, here are some other common use cases:
- Roll up reports across all of your clients to benchmark your agency's performance
"I want to know my average ROAS" - Create a Client Success Dashboard to identify client pains/gains easily
- Roll up reports across all of your clients to benchmark your agency's performance
How To Connect Google Looker Studio to Wicked Reports
The Google Looker Studio Integration is a quick 10-step setup process. In this section below, we've included a video and outlined the step-by-step instructions on how to get the integration up and running. After you've integrated with the Google Looker Studio Integration, you'll be able to set up the custom reports however you see fit!
Video:
Step-by-Step Instructions:
- Within Wicked Reports, create a view in Funnelvision

- Within Wicked Reports, go to your Authorizations page.
- Enable the API for Contacts and Orders


- Now, go to this URL and set up your connector.
Note: Please be sure to use the email address that is associated with the Wicked Reports accounts you are generating reports for.
- If you've already set up your connector within Google Looker Studio, you can find it available under Google Connectors.

- If you've already set up your connector within Google Looker Studio, you can find it available under Google Connectors.
- After authorization, you'll be asked to select the account you would like to use for your data

- Next, you will be provided a list of FunnelVision Views from the selected account. Choose your view and press Next.

- Now, press Connect, and you will be shown all the available columns for the data source.

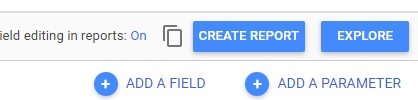
- That's it. You've completed your connection. Simply click the "Create Report" at the top right to get started with your custom report.
Important: Pay close attention to the dataSet field in your Looker Studio report. This field indicates whether the data is sourced from the "grid" or "summary" results of your Funnel Vision View.
dataSet=grid: This means the data comes from the detailed grid results.dataSet=summary: This indicates the data is from the summary results.
To ensure accurate data in your report, make sure you apply the appropriate filters based on whether you’re working with grid or summary data.
FAQ:
- Can I connect more than one Wicked Reports account to my report?
Yes! You can create as many data sources as you like. Those data sources can be from as many accounts as you choose. All the matters is the email address you use, must have access to those Wicked Reports accounts. - Why do you offer Grid and Summary?
When utilizing Full Impact or Full Funnel Attribution in FunnelVision reporting, data deduplication is performed in the summary section of the report. This means that simply summarizing the Grid data will not provide the same summarized data points. To accurately replicate the data shown in FunnelVision with Full Impact or Full Funnel, it is recommended to use the appropriate summary or grid rows in the data source to populate your report. - Why does my Data Source have columns broken into Grid and Summary categories?
To help reduce the amount of data sources needed for any given report, the Looker connector provides both Grid and Summary data points for a View. Columns with data from the Grid are shown under the Grid category and fields with data from the Summary are shown under the Summary category and are prefixed with "summary_"

- How do I optimize my Looker Studio Performance?
To optimize performance:- Reduce the number of "blends" as much as possible. Instead of using blends, we recommend using formulas to achieve the same outcome. This makes much fewer API calls, thus increasing the performance of your report.
- Do not extend past a 30-day date range. Looker Studio has a 6-minute limit to pull data before it throws an error. And, 30 days usually takes a while to digest in Looker. So, by going past 30 days, you will most likely consistently encounter this error.
- Reduce the number of data sources. For example, if you have one large dashboard with many data sources then that will reduce efficiency in your report. So, instead, you can create multiple smaller reports that you pull into the dashboard.
-
What API endpoint does the Looker Studio Integration use?
The endpoint used is Get FunnelVision From Views. This provides view data, broken up day-by-day, so you can review granular date ranges directly through your Looker Studio report.
Troubleshooting
Having trouble with your Looker Studio integration? We’re here to help! This troubleshooting section addresses common issues you might encounter while connecting Looker Studio with your Wicked Reports account. Follow these steps to identify and resolve common problems. If you continue to experience difficulties, don’t hesitate to reach out to our customer support team for further assistance. Let’s get your integration running smoothly!
1. Connector Fails When Selecting Your Wicked Reports Account
- Issue: The connector fails when attempting to select your Wicked Reports account.
- Solution: Ensure that the API is enabled for your account. Navigate to the Authorizations screen, enable the API for Contacts and Orders, and then try again.
2. Report Fails to Load or Times Out
- Issue: Your report fails to load or times out.
- Solution: Google Looker Studio has a 6-minute data source runtime limit. If you have a large dataset or a long date range, this may cause timeouts. Try using a shorter date range or refresh your data to resolve the issue.
3. Data Source Issues with FunnelVision Views
- Issue: Encountering issues connecting to a FunnelVision View.
- Solution: Ensure the View is saved recently. Go to FunnelVision, apply the View, open Filters or Attribution Settings, and click "Save Changes to View." Then, reconnect the data source to the View.
4. Report Shows No Data
- Issue: Your Looker Studio report has no data.
- Solution: Verify that the date range in your Looker Studio report matches the date range of your View. If the View only contains recent data (e.g., last 7 or 30 days) but your report is set to an earlier range (e.g., 60 days ago), adjust the date range in your report accordingly.
5. Grid Column Shows No Data
- Issue: Grid columns are empty in your Looker Studio report.
- Solution: Data displayed in Looker Studio comes directly from your FunnelVision View. Ensure that the columns you want to display in your report are visible in the FunnelVision View settings.
6. Data Discrepancies Between Looker Studio and FunnelVision
- Issue: Data in Looker Studio does not match FunnelVision data.
- Solution: The connector aggregates data daily. This might cause discrepancies in calculated fields like ROAS, CPL, or nCAC. For accurate calculations, use custom fields to compute totals as described in the Field Mappings Help Doc. Ensure you set the appropriate filters for each chart or report based on your data source (e.g.,
dataSet=gridordataSet=summary).
7. Field Mapping Between Wicked UI and Looker Studio
- Issue: Unclear field mappings between Wicked UI and Looker Studio.
- Solution: Refer to our Field Mappings Help Doc for detailed information on how Wicked UI fields map to Looker Studio Data Source fields.
If you encounter issues beyond these common problems, please reach out to our customer support team for further assistance.