- What Is Report By Click Date
- Why You Need This
- How To Use FunnelVision Report when Report by Click Date
- Revenue Breakdown
- FunnelVision Grid
- Facebook Platform Columns
- Frequently Asked Questions (FAQ)
What Is Report By Click Date
You can find the Report by Click Date option in the Attribution Settings of the FunnelVision report.
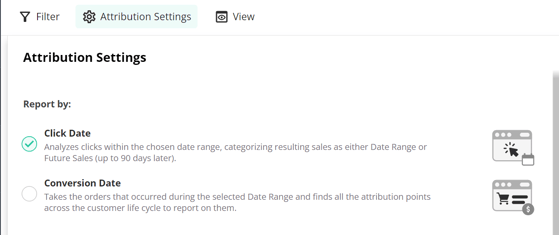
When selecting a date range in this mode, you are selecting the clicks that occurred during the given range and displaying the sales generated by those clicks.
This approach differs from the Reporting by Conversion Date, where all sales within a given date range are considered for attribution reporting, regardless of when the clicks occurred in the customer journey.
Report by Click Date is recommended when analyzing for accounting purposes
You can ask a question similar to "In March, I purchased $5,000 worth of clicks, how much revenue came from those clicks" or "In March, I purchased $5,000 worth of clicks, how much revenue after the month of March from those clicks?"Why You Need This
Oftentimes, if your customer journey can take a bit longer you may want to analyze your data based only on the sales that came from a specific cohort of clicks. This mode of analysis doesn't care about sales that occurred today because of clicks from months prior. It helps to understand the direct impact of a specific set of clicks.
Specific Facebook Data is pulled in daily for easy comparisons between Wicked Reports and Platform data. Click here to see which columns are available
How To Use The FunnelVision Report when Report by Click Date
FunnelVision takes every click in the selected Date Range and finds the sales the came specifically as a result of those clicks. The sales are then broken into "Date Range" sales which occured during the same selected date range and "Future" sales which occured from those clicks, but were transacted up to 90 days after the selected date range.
Using FunnelVision Reporting By Click Date
Filters and Settings
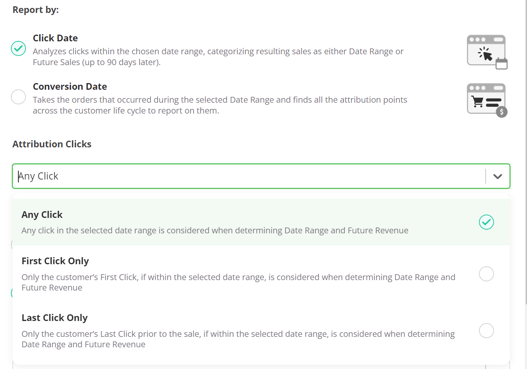
- Attribution Model determines which clicks in the selected Date Range to consider for the cohort of clicks to report on
- Any Click: Any click in the selected date range is considered when determining Date Range and Future Revenue. If the customer had multiple clicks during the selected date range, the earliest one is used.
- First Click Only: Only the customer's tracked First Click, if within the selected Date Range, is considered when determining Date Range and Future Revenue
- Last Click Only: Only the customer's Last Click prior to a sale, if within the selected Date Range, is considered when determining Date Range and Future Revenue. If the customer had multiple purchases and multiple "Last Clicks" during the selected date range, the earliest one is used.
- Revenue Breakdown Linear or Full Impact (see below)
- On used in when "Any Click" is selected for "Clicks to Consider"
Revenue Breakdown (ONLY when using "Any Click" for Attribution Model)
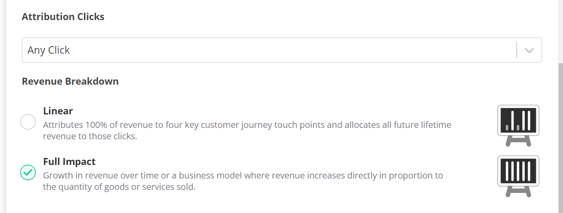
Linear
With Linear Revenue breakdown, every attributed order and it's revenue is divided among all the customer's tracked clicks from the selected Date Range
If a customer made 5 clicks in the selected Date Range for a given order, then every one those clicks will get .2 (20%) of the sale.
Example:
- Date Range: June 2023
- Order Date: June 23, 2023
- The customer made 4 clicks in the month of June prior to placing the order (2 Facebook Ads, a Google Ad and an Email).
- Each Click will show .25 (25%) of a sale
- Facebook Ad 1: .25 sales
- Facebook Ad 2: .25 sales
- Google Ad 1: .25 sales
- Email: .25 sales
Full Impact
With Full Impact Revenue breakdown, every click a customer made in the selected Date Range prior to the customer placing the order, will get full credit for a sale.
Example:
- Date Range: June 2023
- Order Date: June 23, 2023
- The customer made 4 clicks in the month of June prior to placing the order (2 Facebook Ads, a Google Ad and an Email).
- Each Click will show 1 sale
- Facebook Ad 1: 1 sale
- Facebook Ad 2: 1 sale
- Google Ad 1: 1 sale
- Email: 1 sales
The Summary Data will still show only 1 sale. It will NOT overcount. However, the rows in the grid will allow for each row that deserves a sale, to get one.
Date Range and Future Revenue For Cohort
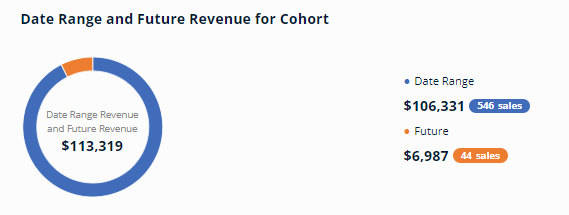
A breakdown of all the attributed sales and revenue displayed by whether the sales occured during the selected Date Range (Date Range Revenue) or up to 90 days after the selected Date Range (Future Revenue)
Future Revenue is the revenue genereated up to 90 days AFTER the selected Date Range, from clicks that occured in the selected Date Range.
If your selected Date Range goes until "yesterday", there are no Future Sales and Revenue to show.
New Customer Value and Cost to Acquire

New Customer Value chart takes the customers with an attributed relevant click during the selected Date Range and plots their avg. value and nCAC over the first 90 Days from their relevant click.
Click Date: Average New Customer value and nCAC on the Click Date used, for new customers who clicked during the selected Date Range and made their first purchase the same day
30 Days: Average New Customer value and nCAC 30 days after the Click Date used, for new customers who clicked during the selected Date Range and made their first purchase up to 30 days later
60 Days: Average Customer value and nCAC 60 days after the Click Date used, for new customers who clicked during the selected Date Range and made their first purchase up to 60 days later
90 Days: Average Customer value and nCAC 90 days after the Click Date used, for new customers who clicked during the selected Date Range and made their first purchase up to 90 days later
When using Facebook View-Through Conversions, the CAC calculation is estimating how many of your Facebook View-Through conversions were new customers and assumes their first purchase was day of the view-through conversion.
The costs are applied on the Click Date for this chart.
At anytime, you can toggle the New Customer Value chart to the "All Time" option and the chart will update to ignore all filters and settings to report on all of your customers throughout the entirety of your business for which Wicked Reports has imported your orders and customers. It then provides a 365 Day Value for all those customers from the date of acquisition along with nCAC for all customers.

Revenue Section ("Date Range" Sales and Revenue)
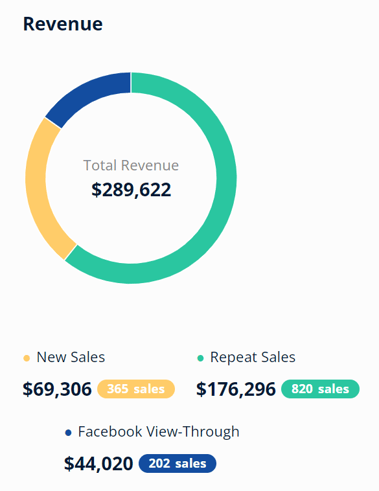
Total Revenue is a De-Duplicated sum of the "Date Range" revenue from the attributed sales during the selected time period and filters.
The Pie Chart is a De-Duplicated breakdown of "Date Range" revenue from New Sales vs. Repeat Sales. See at a glance what percentage of sales are a customer's first sale or a repeat sale.
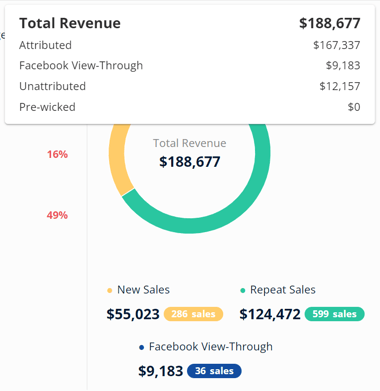
When in the Overall Channel and hover over the Total Revenue, there will be a breakdown of Attributed Revenue, Unattributed Revenue and Pre-wicked Revenue.
- Unattributed sales all the sales in which no tracked clicks occurred during the selected date range
- Pre-wicked sales all sales from leads that were acquired prior to using Wicked Reports
Along the Top-Right, is a breakdown of "Date Range" One-Time Revenue (and Sales), New Subscription Revenue (and Sales) and Recurring Subscription Revenue (and Sales)
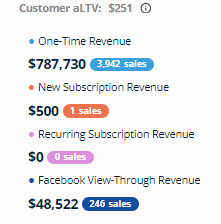
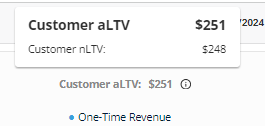
At the Top is a Customer aLTV. This customer aLTV is calculated by taking all the attributed sales' Customers from the selected Date Range and provides an Avg. lifetime value from those specific customers. Hovering will also provide the nLTV value for the New Customers.
Summary Stats ("Date Range" values)

Costs: Total costs based on the selected Date Range and filters
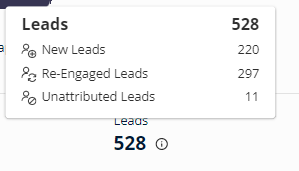
Leads: Total Leads based on the selected Date Range and filters. Hover for Tool-tip breakdown of New Leads vs. Re-Engaged Leads
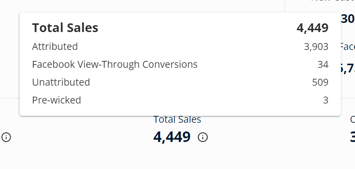
Total Sales: Total attributed sales based on the selected Date Range and filters. When in Overall Channel, hover for Tool-tip breakdown of Attributed, Facebook View-Through, Unattributed and Pre-wicked sales counts.
When in Facebook Channel, hover for Tool-Tip breakdown of Attributed and Facebook View-Through sales counts
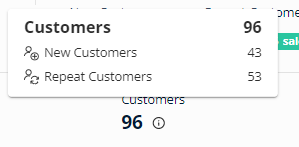
Customers: Total count of de-duplicated customers based on the selected Date Range and filters. Hover for Tool-tip breakdown of New Customers vs. Repeat Customers.
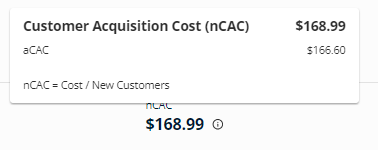
nCAC: New Customer Acquisition Cost based on the selected Date Range and filters
- nCAC: Costs / New Customers
- aCAC: Costs / Total Customers
ROI / ROAS: ROI and ROAS based on the selected time-frame and filters.
- ROI: (Total Revenue - Costs) / Costs (as a %)
- ROAS: Total Revenue / Costs (as a decimal)
- Tool-tip shows the ROI and ROAS for Date Range and Future revenue
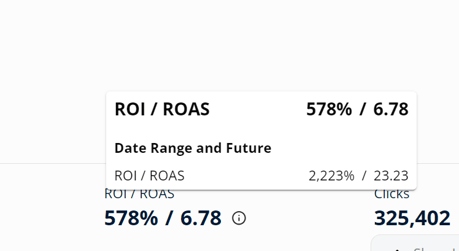
Clicks: Clicks based on the selected time-frame and filters.
Grid ("Date Range" values)
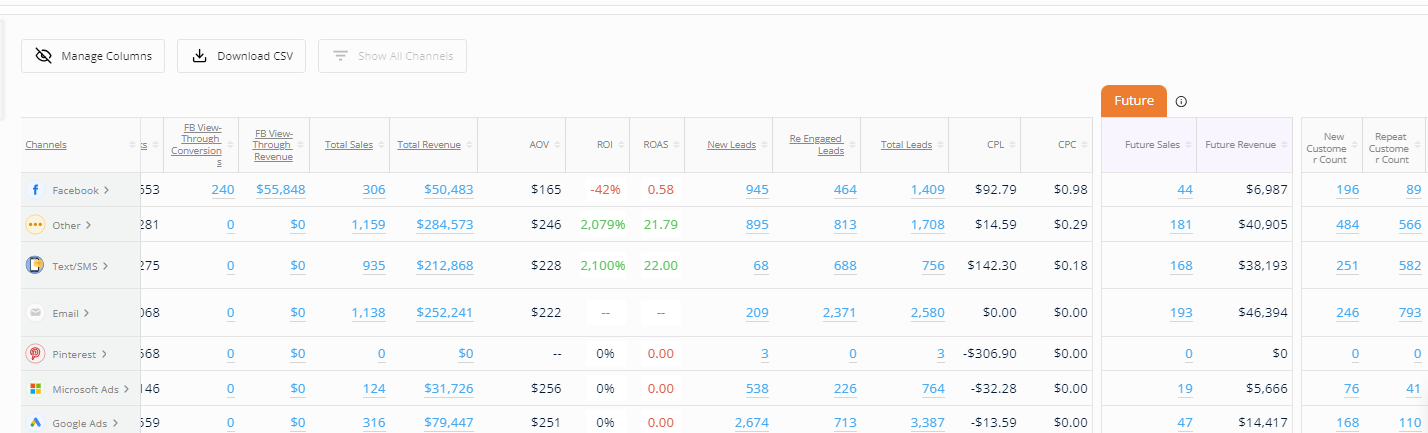
The Grid shows the detailed results of clicks from the selected Date Range and filters along with the Future sales and Revenue from those clicks.
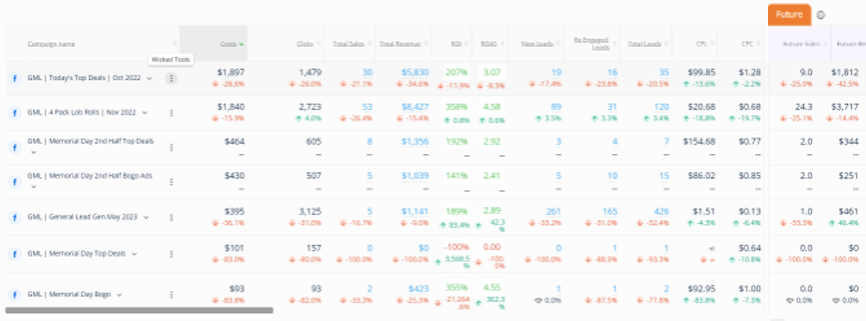
When using the Compare To functionality, the Grid will show the Up/Down trend information comparing the Compare to Period to the selected date range.
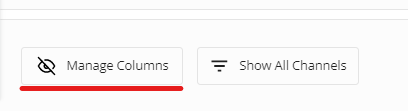
Columns can be hidden or shown and moved around using the Manage Columns button above the grid
Available Columns
- Channel Only in Overall Channel
- Campaign name Ad Campaign Name or utm_campaign value
- Source (hidden by default) Channel Name or utm_source value
- Medium (hidden by default) ppc or utm_medium value
- Ad Set / Ad Group / Term (hidden by default) Facebook Ad Set Name, Google Ads Ad Group Name, etc or utm_term value
- Ad Name / Keyword / Content (hidden by default) Facebook Ad Name, Google Ads Keyword, etc or utm_content valuev
- Costs total costs for the given row for the selected Date Range and filters
- Clicks total clicks for the given row for the selected Date Range and filters
- FB View-Through Conversions (In overall or Facebook Channel) Facebook View-Through Conversions for the given row for the selected Date Range and filters (multiplied by the Facebook View-Through Confidence Score)
- FB View-Through Revenue (In overall or Facebook Channel) Facebook View-Through Conversion Revenue for the given row for the selected Date Range and filters (multiplied by the Facebook View-Through Confidence Score)
- Total Sales total attributed sales for the given row for the selected Date Range and filters
- Total Sales = Facebook View-Through Conversions + Attributed Sales
- Clicking Total Sales will provide a popup of the Sales details filtered for All Sales
- Total Revenue Total attributed revenue for the given row for the selected Date Range and filters
- Total Revenue = Facebook View-Through Revenue + Attributed Revenue
- Hover Tool-tip will provide a breakdown of One-Time revenue, New Subscription revenue and Recurring Subscription revenue
- AOV Average Order Value of the attributed sales for the selected Date Range and filters
- ROI ROI for the given row for the selected time-frame and filters
- (Total Revenue - Costs) / Costs
- ROAS ROAS for the given row for the selected Date Range and filters
- Total Revenue / Costs
- New Leads New leads acquired for the given row for the selected Date Range and filters
- Clicking New Leads will provide a popup of the Leads details filtered for New Leads
- Re-Engaged Leads Re-Engaged leads for the given row for the selected Date Range and filters
- Clicking Re-Engaged Leads will provide a popup of the Leads details filtered for Re-Engaged
- Total Leads Total Leads for the given row for the selected Date Range and filters
- New Leads + Re-Engaged Leads
- Clicking Total Leads will provide a popup of the Leads details filtered for All Leads
- CPL Costs per New Lead for the given row for the selected Date Range and filters
- Costs / New Leads
- CPC Costs per click for the given row for the selected Date Range and filters
- Costs / Clicks
- Future
- Future Sales Total attributed sales that occured up to 90 days AFTER the selected Date Range, because of the attributed clicks being reported on
- Future Revenue Total attributed revenue that occured up to 90 days AFTER the selected Date Range, because of the attributed clicks being reported on
- Facebook Columns
When in the Facebook Channel, these Facebook fields are available in the grid
for Facebook data through yesterday

When released (June 1, 2023), accounts are seeded with 30 days of historical Facebook data. If you need more than 30 days, please contact support about importing more historical data.
-
- Date Created The Date when this campaign, ad set or ad was newly created
- Status (On/Off) The current Status of the Ad/Ad Set/Campaign you are looking at.
- The Status is updated every hour.
- Website adds to cart The number of add to cart events tracked by the pixel or Conversions API on your website and attributed to your ads.
- Note: In some cases, this metric may be estimated
- Meta Add to Cart The number of add to cart actions within Meta technologies (such as Pages or Messenger) and attributed to your ads.
- Cost per add to Cart The average cost of each add to cart
- Note: In some cases, this metric may be estimated and reported by a third-party API
- Website Purchases The number of purchases events tracked by the pixel or Conversion API on your website and attributed to your ads
- Note: In some cases, this metric may be estimated
- Website Purchase Conversion Value The total value of website purchases conversions
- Note: In some cases, this metric may be estimated
- Meta Purchases The number of purchases made within Meta technologies (such as Pages or Messenger) and attributed to your ads
- Meta purchase conversion value The total value of purchase conversions on Meta technologies
- Website Purchase ROAS The total return on ad spend (ROAS) from purchases on your website
- Note: In some cases, this metric may be estimated
- Impressions The number of times your ads were on screen
- CPM The average cost for 1,000 impressions
- Outbound Clicks The number of clicks on links that take people off Meta technologies
- Outbound Click Through Rate The percentage of times people saw your ad and performed an outbound click
- Cost Per Outbound Click The average cost per outbound click
- New Customer Count count of New Customers from the attributed sales for the given row for the selected Date Range and filters
- Clicking New Customer Count will provide a popup of the Customer details filtered for New Customers
- Repeat Customer Count count of Repeat Customers from the attributed sales for the given row for the selected Date Range and filters
- Clicking Repeat Customer Count will provide a popup of the Customer details filtered for Repeat Customers
- Total Customers count of all customers from the attributed sales for the given row for the selected Date Range and filters
- New Customer Count + Repeat Customer Count
- Clicking Total Customer will provide a popup of the Customer details filtered for All Customers
- nCAC cost to acquire new customers for the given row for the selected Date Range and filters
- Costs / New Customer Count
- aCAC cost to acquire all customers for the given row for the selected Date Range and filters
- Costs / Total Customer Count
- nLTV Avg. Lifetime value of new customers from the attributed sales for the given row for the selected Date Range and filters
- we take all the new customers based on filter criteria and get their lifetime values and then provide the avg. of those values.
- aLTV Avg. Lifetime value of all customers from the attributed sales for the given row for the selected Date Range and filters
- we take all the customers based on filter criteria and get their lifetime values and then provide the avg. of those values.
- EPC Earning Per Click for the given row for the selected Date Range and filters
- Total Revenue / Clicks
- EPL Earning Per New Lead for the given row for the selected Date Range and filters
- Total Revenue / New Leads
- First Click Date Earliest date a tracked click was recorded for the given row for the selected Date Range and filters
- Last Click Date Most recent date a tracked click was recorded for the given row for the selected Date Range and filters
- One-Time Sales count of attributed one-time sales for the given row for the selected Date Range and filters
- Clicking One-Time Sales will provide a popup of the Sales details filtered for One-Time Sales
- New Subscription Sales count of attributed new subscription sales for the given row for the selected Date Range and filters
- Clicking New Subscription Sales will provide a popup of the Sales details filtered for Subscription Sales
- Recurring Subscription Sales count of attributed recurring subscription sales for the given row for the selected Date Range and filters
- Clicking Recurring Subscription Sales will provide a popup of the Sales details filtered for Subscription Sales
Wicked Tools Options
Every row in the FunnelVision Grid has 3 dots which are the Wicked Tools options
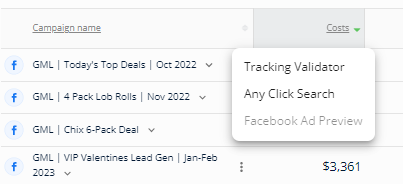
- Tracking Validator Tool to validate the URLs found for the selected row
- Any Click Search Opens the Customer LTV report using Any Click search for the selected Row
- Answers the question: "Find me all sales where this row was clicked anytime prior to a sale"
- Facebook Ad Preview When looking at Facebook Ad Rows, this will show you the most recent ad creative for the given Facebook Ad
Frequently Asked Questions (FAQ)
- Why doesn't my shopping cart sales match what I see in Wicked Report
Reporting by Click Date is unlikely to match your shopping cart results. The reason is that your shopping cart is showing you all the sales that occurred on a specific day or set of days. Reporting by Click Date is only looking at sales that occurred because of clicks that also occurred during your selected date range (and up to 90 days after). So, it's possible there were sales that happned, but no click was tracked during the selected Date Range. Those sales are ignored when Reporting by Click Date. Reporting by Conversion Date instead will allow you to align your reporting with all the sales occurred in selected Date range
- What does "Ignore Organic Clicks?" Do?
Organic clicks are any clicks recorded without any UTMs or tracking parameters. These are clicks we've bucketed into organic campaigns "Direct", "Organic Search", "Referral" and "Social".
When Ignoring Organic Clicks, FunnelVision will process the reports as though these clicks never occurred. Using Full Impact Revenue Breakdown, there won't be much difference in the reporting. Using Linear is where there's likely a bigger difference. Linear Revenue Breakdown splits credit for a sale among all the eligible clicks that occurred in the TOF, MOF and BOF. If you include Organic clicks, there are more clicks used in the calculation and can dilute the credit your paid ads, emails and sms will get for a sale. This is why when analyzing paid marketing, we recommend ignoring Organic clicks.
- What is included in "Future" Sales and Revenue
- Why does New Customer Cohort not match FunnelVision New Customers (within a channel)?
For any given channel, the amount of sales (and customers) is calculated differently. Cohort is using ROI Report attribution points (First Click First Optin, Last Click and Re-Optin) So, unless you are in Overall Channel, you should not expect New Customer Cohort to match FunnelVision New Customers
- Why doesn't the Facebook Columns data match what I see in Facebook?
Facebook columns are pulled in once daily. This means that are NOT live. Be sure to NOT include today, in your Facebook date range.
Also be aware that when the Facebook data columns were added to Wicked Reports, only 30 days worth of data was imported. So, if you are going back before May 2023, the data may not be complete. Note: If you need more data imported, please contact support and they can help you get more Facebook data into your Wicked Reports account
- How do I compare two date ranges?
To compare multiple date ranges, toggle the Compare to period option in the filters and select a previous time period to compare. After you apply the changes, you will see the up/down trend for the data points. If you hover over the up/down trend, you will see the value from the previous period to show why the trend is up/down.