- When to use the Customer Cohort report
- How to use the Customer Cohort report
- VIDEO: Wicked Quick Wins - Evaluating CAC and LTV and ROI over time with the Customer Cohort
- Common Marketing Optimization Scenarios that New Lead Cohort Reporting can Solve
- Why You Need This
- Fields and Filters
- Marketing Optimization Tips
- Troubleshooting
When to use the New Customer Cohort report
One great thing about this report is that it can be used 1 day after shopping cart have been integrated, before we consider attribution to the source or campaign.
You can revisit this report after a month of lead tracking to see the impact of ad spend and marketing source on lead value for each cohort.
How to use the New Customer Cohort report
These plays can be used on Cohorts of any age and source
What is an optimal cost to acquire a customer (nCAC) when I want to break-even as fast as possible?
- Select the sources with ad spend.
- Look at the break-even column and find the fastest break-even month.
- Use that nCAC as your goal.
How profitable are my customers over time?
- Scan across a row to see the customer value increase.
- Filter by different paid sources to see how that impacts value up/down.
When do I break-even acquiring a customer?
- Filter by different paid sources
- Look at the break-even column.
- When the number is lower or higher, what was different about that month in your campaigns?
When do the customers double in value?
- Look at the customer value day 0.
- Scan across the row looking for double the value.
- Alternatively, look for when the ROI is double in value.
- If the timeframe is acceptable, and you are already making $ on your nCAC, increase the budget or increase the nCAC.
What was the best marketing for generating customers?
Scroll down towards the bottom to the Top 5 Last Clicks. These are the 5 last click links that generated the most revenue from the leads across all the cohorts in the cohort grid above.
The plays below can be run on all cohorts 90 days or older
When I buy more customers in a given month, does it lead to more money in the future?
- Find the higher customer count months.
- Look at the revenue column for that month.
- Filter by different paid sources to see how that impacts value up/down
What months generated the best or worst customers?
- Pick a date in the future for the cohort at least 90 days out.
- Scan vertically for the highest value - those are your most valuable customers.
- Scan vertically for the lowest value - those are your least valuable customers.
Compare CAC to the value at Month 3 - the biggest spread was your best month and you should investigate what you were doing that month to make this happen - and double down.
VIDEO: Wicked Quick Wins - Evaluating CAC and LTV and ROI over time with the new customer cohort
Common Marketing Optimization Scenarios that New Customer Cohort Reporting can Solve
- Paid media campaigns don't see positive ROI fast and you aren't sure how long to run them?
- Attracting customers from multiple channels and not sure which channel acquires the most valuable ones?
- Working hard to get repeat buyers, subscription recurring sales via your monthly ecom boxes, or membership course subscription sales and not sure when/how the lifetime value is accumulating?
Why You Need This
One area that separates the pros from the amateurs is customer lifetime value. Great customers that repeat buy can provide foundational revenue for growth. Paid media channels and campaigns that find higher lifetime value customers deserve more budget and attention.
Your highest lifetime value customers might come from a channel where the leads cost more, or the lead quantity is lower, or your budget is lowest.
Too often the focus is on immediate ROI from a paid media campaign. Customer cohort reporting can guide you to strategies not apparent with a short-term focus.
Fields and Filters
The New Customer Cohort report looks at all new customers created in a specific time bucket and their actual lifetime value based on the order system you have integrated with Wicked Reports. New customer cohort Analysis is done on auto-pilot for you!
This report gives valuable customer lifetime value insights even before Wicked Reports has tracked a click or attributed a sale.
You can run this report without changing any filters, simply click “Apply Filters”. I suggest putting a best cost per lead guestimate into the “Cost to Acquire Customer” filter field so that you can take advantage of the automatic break-even calculation.
The results of the New Customer Cohort report show the quantity and value of new customers as they accrue lifetime value over the date interval & time range selected.
The primary use cases of this report are to optimize paid media bidding & budget based on the following insights:
- How to determine break-even date on your new customer acquisition paid media campaigns
- How to determine how long it takes for you to make an acceptable profit on your new customers
- How to optimize what you can pay for new customers
- How to evaluate your customer value maximization efforts
- How to find paid media that leads to the highest value customers
Let’s look at the report & filter fields and then walk through the report use cases below.
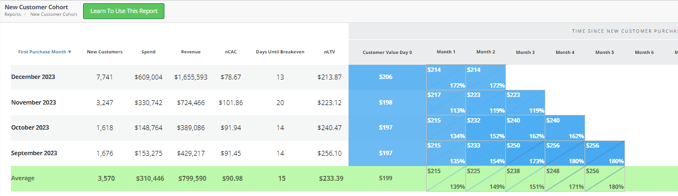
| Report Field Name | Report Field Description |
| First Purchase Month | The month that the new customer was created in your order system (such as Shopify, Stripe, or WooCommerce). |
| New Customers | The number of new customers created in your order system for that month. |
| Spend | Costs recorded for each month |
| Revenue | Lifetime revenue from the New Customers for each month |
| nCAC | New Customer Acquisition Cost: Costs / New Customers |
| Days Until Breakeven | We take the cost to acquire a customer * the number of customers and compare it against the revenue the new customers generate from the orders you have integrated with Wicked Reports. The moment that the revenue over time eclipses the cost to acquire customers from the time period, you’ve hit breakeven. |
| nLTV | Average Lifetime Revenue of the New customers from the given month |
| Customer Value Day 0 | The revenue from the new customers on the same day that the customers are first detected in your order system. |
| Month 1 (or other date intervals displayed based on your filter selections) | The accumulated revenue of all the new customers for the time period of the row divided by the number of new customers on the row. |
Here are the New Customer Cohort report filter options and descriptions:
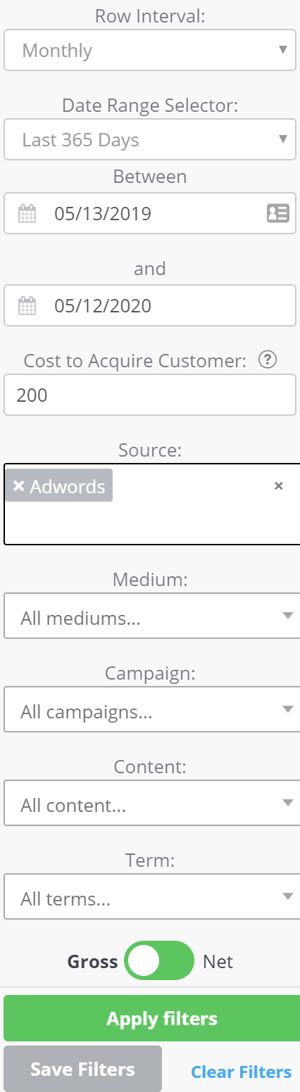 Row Interval - The default time increment to use for each column.
Date Range Selector -What time period to use for the customer and revenue data to be analyzed.
Cost to Acquire Customer - This value is used to determine the breakeven point in days of the cohort.
Source - The marketing source that created the new customer. Leave blank to consider all customers created in the time period irregardless of source.
Medium - The marketing medium that created the new customer. Leave blank to consider all customers created in the time period regardless of medium.
Campaign - The marketing campaign that created the new customer. Leave blank to consider all customers created in the time period regardless of campaign.
Content - The marketing content that created the new customer. This could be the Facebook ad, Google Ad Group, or specific organic landing page that led to the new customer creation. Leave blank to consider all customers created in the time period regardless of content.
Term - The marketing term that created the new customer. This could be the Facebook adset, Google keyword or display URL,, or other specific targeting that led to the new customer creation. Leave blank to consider all customers created in the time period regardless of term.
Gross/Net - Revenue filter that will show either gross or net amount. The gross/net calculation is highly dependent on your order system integration. Read more on how we calculate gross vs net revenue here.
Marketing Optimization Tips

If you currently have a Max CPA/Customers target cost on a Google smart bidding campaign and your bid is lower than what you have discovered in the New Customer Cohort Report, raise your Google smart bid. The Google algorithm most likely will maximize your conversions at a better overall ROI by either bidding on more valuable potential customers or increasing your customer volume. Let Wicked & Google help you with this.
Use the source filter to see which channel is providing the highest customer lifetime value. Consider moving budget to that channel.
If you are dismayed with your customer lifetime value increase over time, look at marketing to your existing customers differently. Then use this report to see if the changes had any impact. Retargeting paid media and Good ole email can help convert existing customers to become repeat buyers.
Troubleshooting
Product Costs are not included in this report. You will want to add a blended product cost to the “Cost to acquire customer" field. If you have a lot of products with wildly different costs, consider our Product Purchase Cohort report.
If you filter on the fields Source, Medium, Campaign, Content, or Term, and do not see revenue, this means you either do not have any New customer attribution for the value selected or your revenue was not loaded for the time period.
Wicked can report on any historical tracking information you have collected in your CRM or home-grown tracking tool and then perform New Customer Cohort analysis on those combined data sources. See how to import historical tracking data here.
FAQ
- How is ROI % calculated in the new Customer Cohort Report:
ROI % for a new customer cohort is calculated by comparing the revenue generated from the cohort to the cost associated with acquiring that cohort. Here’s a breakdown of how ROI % is typically calculated:- The ROI Calculation is (Rev - Costs) / Costs x 100
- How is the average ROI % calculated in the new Customer Cohort Report:
To find the average ROI % across all cohorts, sum the individual ROI% values for each cohort. Then, divide the total by the number of cohorts you are analyzing. This gives you the average ROI % for all the cohorts considered.-
Example: Let’s assume you have 3 cohorts with the following ROI%:
- Cohort 1 ROI% = 100%
- Cohort 2 ROI% = 200%
- Cohort 3 ROI% = 300%
The average ROI% would be:
Average ROI % = 100 + 200 + 300 / 3 = 200%
-
- What attribution model does the New Customer Cohort report use?
It uses the 4-Point Attribution Model, which tracks First Click, First Optin, Reoptin, and Last Click touchpoints.