The Wicked Reports First Click Cohort report connects your CRM contacts and their tracked first clicks to your shopping cart customers to give deep insights into their value. As we attribute marketing spend over time, we can further segment the insights by marketing channel, campaign, and targeting.
- When to use the First Click Cohort report
- How to use the First Click Cohort report
- Common Marketing Optimization Scenarios that First Click Cohort Reporting can Solve
- Why You Need This
- Fields and Filters
- Marketing Optimization Tips
- Troubleshooting
When to use the First Click Cohort report
This report can be used once tracking begins to occur and new customers are found. The report can only go back as far as your tracking and therfore you likely won't be using this report for the first couple of weeks.
This report first click tracking and shopping cart have been integrated to drive insights into how valuable your cold traffic and their first clicks are before we consider attribution to the source or campaign.
You can revisit this report after a month of click tracking to see the impact of ad spend and marketing source on cold traffic for each cohort.
How to use the First Click Cohort report
These plays can be run on cohorts of source back as far as you've been tracking with Wicked Reports
What is an optimal New Customer Acquisition Cost (CAC) when I want to break-even as fast as possible?
- Select the sources with ad spend.
- Look at the break-even column and find the fastest break-even month.
- Use that CAC as your goal.
How profitable is my Cold Traffic over time?
- Scan across a row to see the value increase.
- Filter by different paid sources to see how that impacts value up/down.
When I buy more cold traffic in a given month, does it lead to more money?
- Find the higher first click count months.
- Look at the revenue column for that month.
- Filter by different paid sources to see how that impacts value up/down
When do I breakeven on my cold traffic campaigns?
- Filter by different paid sources
- Look at the break-even column.
- When the number is lower or higher, what was different about that month in your campaigns?
What was the best marketing for generating customers from cold traffic?
- Scroll down towards the bottom to the Top 5 Last Clicks. These are the 5 last click links that generated the most revenue from the cold traffic across all the cohorts in the cohort grid above.
What months generated the best or worst cold traffic?
- Pick a date in the future for the cohort, at least Month 3 or older.
- Scan vertically for the highest value - those are your most valuable customers.
- Scan vertically for the lowest value - those are your least valuable customers.
- Compare CAC to the value at Month 3 - the biggest spread was your best month and you should investigate what you were doing that month to make this happen - and double down.
Common Marketing Optimization Scenarios that the First Click Cohort Report Can Solve
- Receiving a report from your media buyer on your New Customer Acquisition Cost (CAC) and having no idea if this is a “good” number?
- Sick of focusing on cheap traffic and having no clue if they turn into profitable customers?
- Cold Traffic campaigns are rarely ROI positive in the first few weeks after launch?
- Working hard to get repeat buyers, subscription recurring sales via your monthly ecom boxes, or membership course subscription sales and not sure when/how the lifetime value is accumulating?
Why You Need This
Setting a correct New Customer Acquisition Cost (CAC) can be more challenging than you think. While everyone wants more traffic, as cheap as possible, that type of thinking can lead to a focus on cheap traffic at the expense of good leads. Many times leads are cheap because they aren’t any good.
Cold Traffic Campaigns that generate new leads don’t look profitable until those leads buy. The new leads can sometimes (unfortunately) take weeks or months to buy. This causes media buyers to favor quick sale campaigns, often at lower initial value, due to the shorter path to ROI. This may or may not be a smart move - cohort reporting can let you know the answer.
Volume or value is a never-ending media buying debate - cohort analysis can guide your specific business to the right answer for your marketing at this point in time.
Fields and Filters
The First Click Cohort report looks at all first clicks tracked created in a specific time bucket and then their actual lifetime value based on the order system you have integrated with Wicked Reports. Cohort Analysis is done on auto-pilot for you!
You can run this report without changing any filters, simply click “Apply Filters”. The results of the First Click Cohort report show the quantity and value of a first click as it accrues lifetime value over the date interval & time range selected.
The primary use cases of this report are to optimize paid media bidding & budget based on the following insights:
- How to determine break-even date on your cold traffic paid media campaigns
- How to determine how long it takes for you to make an acceptable profit on cold traffic
- How to optimize what you can pay for new customers
- How to evaluate your customer value maximization efforts
- How to find paid media that leads to the highest value customers
Let’s look at the report & filter fields and then walk through the report use cases below.
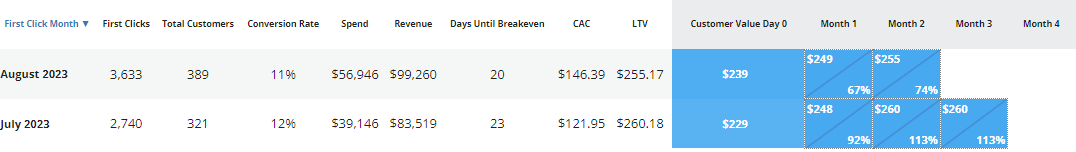
| Report Field Name | Report Field Description |
| First Click Month | The month that the new lead made their first click |
| First Clicks | The number of tracked first clicks that month |
| Total Customers | The number of the first clicks that month that eventually became new Customers . |
|
Conversion Rate |
(Total Customers / First Clicks) * 100% |
|
Spend |
Costs Recorded for each Month |
|
Revenue |
Lifetime Revenue from the new Customers for each month |
|
Days Until Breakeven |
We take the CAC * the number of customers and compare it against the revenue the customers generate from the orders you have integrated with Wicked Reports. The moment that the revenue over time eclipses the CAC from the time period, you’ve hit breakeven. |
| Customer Acqusition Costs (nCAC) | Spend / Total Customers (as this is a First Click cohort, all cusotmers are new Customers) |
| nLTV | Long Term Value is the average total lifetime revenue from each new customer from the given month |
| Customer Value Day 0 | The avg. LTV of the Customers on the day they made their first click |
| Month 1 (or other date intervals displayed based on your filter selections) | The accumulated revenue of all the customers for the time period of the row divided by the number of customers on the row. |
Here are the First Click report filter options and descriptions:
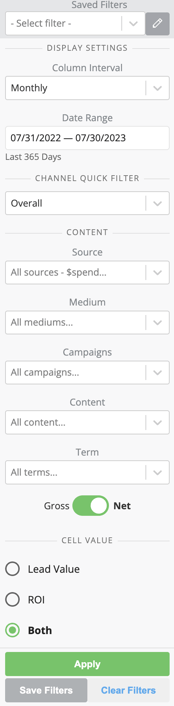
|
Saved Filters - The ability to pull up Quick Channel Filter - What ad platform you want to filter by. Date Range Selector - What time period to use for the first clicks and revenue data to be analyzed. Source - The marketing source that created the first click. Leave blank to consider all first clicks tracked in the time period irregardless of source. Medium - The marketing medium that created the first click. Leave blank to consider all first clicks tracked in the time period irregardless of medium. Campaign - The marketing campaign that created the first clicks. Leave blank to consider all first clicks tracked in the time period irregardless of campaign. Content - The marketing content that created the first clicks. This could be the Facebook ad, Google Ad Group, or specific organic landing page that led to the new lead creation. Leave blank to consider all first clicks tracked in the time period irregardless of content. Term - The marketing term that created the first clicks. This could be the Facebook adset, Google keyword, or other specific targeting that led to the first clicks. Leave blank to consider all first clicks tracked in the time period irregardless of term. Gross/Net - Revenue filter that will show either gross or net amount. The gross/net calculation is highly dependent on your order system integration. Read more on how we calculate gross vs net revenue here. |
Marketing Optimization Tips

When you are running Facebook cold traffic campaigns that have excluded your email list, you can use the First Click Cohort Report to see the exact point in time the customers are becoming ROI positive (if ever). If the timeframe until ROI positive is acceptable, you can buy customers at a short-term loss.
Adjust your bids so that you are hitting your profit goals in an acceptable time frame. The balance between “make as much profit as possible on each customer” vs. “make as much from as many customers as possible due to the quantity of customers” is a fickle balance you must decide..
Troubleshooting
If you filter on the fields Source, Medium, Campaign, Content, or Term, and do not see revenue, this means you either do not have any First Clicks tracked for the value selected or your revenue was not loaded for the time period.
Be sure to use a Date Range in which you know you have been tracking clicks across your site.
There is a chance that the customer value for the last period in the cohort may match the period before it. For example:
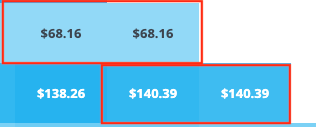
This happens when your customers for that cohort and period haven't yet bought for the specified period. This is normal and will adjust as your customers do purchase.