![wicked logo.webp]](https://help.wickedreports.com/hs-fs/hubfs/wicked%20logo.webp?height=40&name=wicked%20logo.webp)
On This Page
- How the Attribution Report Is Organized
- Report Controls
- Business Snapshot
- Marketing Performance
- Actual and Predicted Future Performance
- Attribution Settings
- Attribution Breakdown
- Day, Week, and Month Performance Breakdown
- Recommended Attribution Workflow
- FAQ
It combines overall business results, attributed marketing performance, and detailed channel-to-ad-level analysis in one report. Use it to understand what happened, identify which marketing efforts contributed to those results, and determine where to investigate or optimize next.
The Attribution Report can help answer questions such as:
- How much revenue did my marketing generate?
- Which channels, campaigns, ad sets, and ads are performing best?
- Where should I increase or decrease spend?
- How is performance changing compared to another period?
- How much additional revenue is expected from recent marketing activity?
- Which marketing efforts are acquiring new customers efficiently?
Unlike individual ad platforms, Wicked Reports applies a consistent attribution methodology across your marketing channels. This gives you a common framework for comparing performance regardless of where the marketing occurred.
How the Attribution Report Is Organized
The Attribution Report moves from high-level business performance to detailed marketing analysis.
Business Snapshot
How did my business perform? 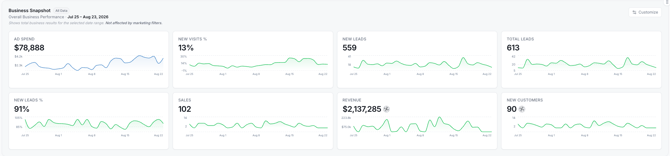
Note: No filters can be applied in this module, the numbers will change based on date range selected.
Marketing Performance
How did my marketing perform?
Attribution Breakdown
Which channels, campaigns, ad sets, and ads contributed to that performance?
Filters, Attribution Settings, comparisons, and Saved Views provide additional ways to configure and investigate the report.
Report Controls
The controls above the report determine the time period, customer scope, marketing scope, and attribution methodology used in your analysis.

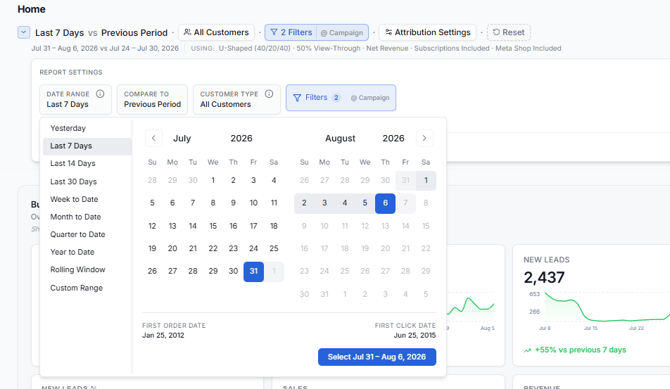
Date Range
Select the period you want to analyze.
The Attribution Report includes preset date ranges as well as rolling and custom options, including:
- Yesterday
- Last 7 Days
- Last 14 Days
- Last 30 Days
- Week to Date
- Month to Date
- Quarter to Date
- Year to Date
- Rolling Window
- Custom Range
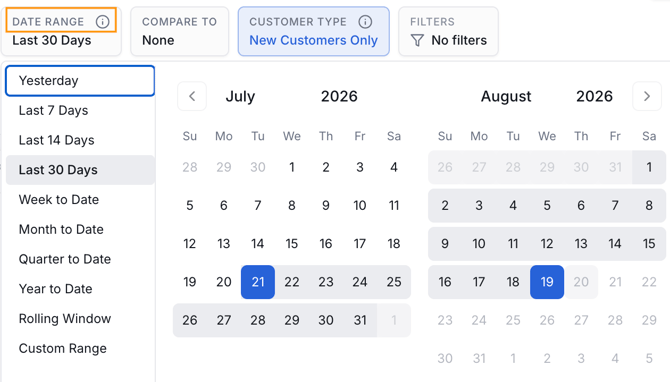
The selected date range applies throughout the Attribution Report, including Business Snapshot.
Compare Period
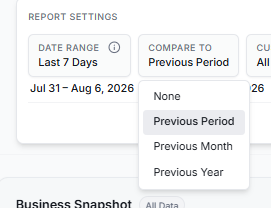
Use comparison to evaluate performance against another period, such as:
- Last 7 days vs. previous 7 days
- This month vs. previous month
- A custom period vs. the same period the previous year
When comparison is enabled, the report shows how performance changed between the selected period and the comparison period.
Customer Type
Use the customer selector to determine which customer population you want to analyze.
Available options may include:
- All Customers
- New Customers
- Returning Customers
This is particularly useful when evaluating customer acquisition separately from repeat customer activity.
Business Snapshot
What It Answers
How did my business perform during this period?
Business Snapshot provides the overall business context for your attribution analysis.
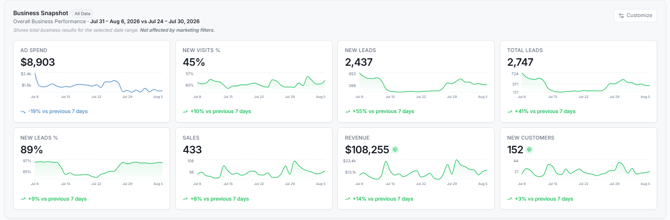
Depending on your customized configuration, Business Snapshot can include metrics such as:
- Ad Spend
- New Visits %
- New Leads
- Total Leads
- New Leads %
- Sales
- Revenue
- New Customers
- Repeat Customers
- Total Customers
- New Cutomer %
- AOV
- MER
Each card provides the metric value, its trend over the last 30 days, and comparison information when a comparison period is enabled.
Why Business Snapshot Is Different
Business Snapshot reports overall business outcomes rather than attributed marketing results.
For example:
Business Snapshot Revenue answers:
How much revenue did my business generate during this period?
Marketing Performance Revenue answers:
How much revenue is attributed to the marketing activity being analyzed?
Those values are not expected to necessarily match.
Business Snapshot and Filters
Business Snapshot responds only to the date range.
If you filter the report to Meta Ads, a specific campaign, or another marketing segment, Business Snapshot continues to show overall business performance for the selected dates.
This gives you a stable business benchmark while investigating a specific subset of your marketing.
For more details on how filters work across the Attribution Report, see How to Use Filters and Saved Views in the Wicked 2.0 Attribution Report for details.
Customizing Business Snapshot
Select Customize to configure which available metrics appear in Business Snapshot.
Marketing Performance
What It Answers
What results did my marketing generate?
Marketing Performance summarizes performance attributed to the marketing activity currently included in the report.
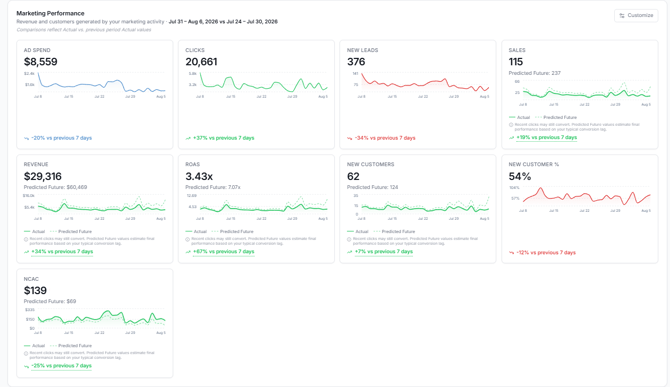
Depending on your customized configuration, some available metrics include:
- Ad Spend
- Clicks
- New Leads
- Sales
- Predicted Future Sales
- Revenue
- Predicted Future Revenue
- ROAS
- Predicted Future ROAS
- New Customers
- Predicted Future New Customers
- New Customer %
- New Customer Acquisition Cost (nCAC)
- Predicted Future nCAC
- And More...
Unlike Business Snapshot, Marketing Performance responds to the applicable filters in the report.
For example, if you filter the report to Meta Ads, Marketing Performance summarizes the results attributed to the filtered Meta activity.
Actual and Predicted Future Performance
One of the most important concepts in the Attribution Report is conversion lag.
Customers do not always purchase immediately after interacting with marketing. A customer may click an ad today but purchase several days or weeks later.
Evaluating recent marketing using only conversions that have already occurred can therefore make recent campaigns appear artificially weak.
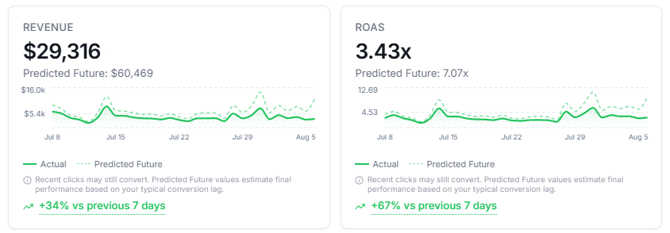
Wicked Reports accounts for this by showing Actual and, where applicable, Predicted Future performance.
Actual
Results that have already occurred and have been attributed to the marketing activity.
Predicted Future
Additional results Wicked Reports predicts sales that will occur as customers who have already interacted with your marketing continue through their buying journey.
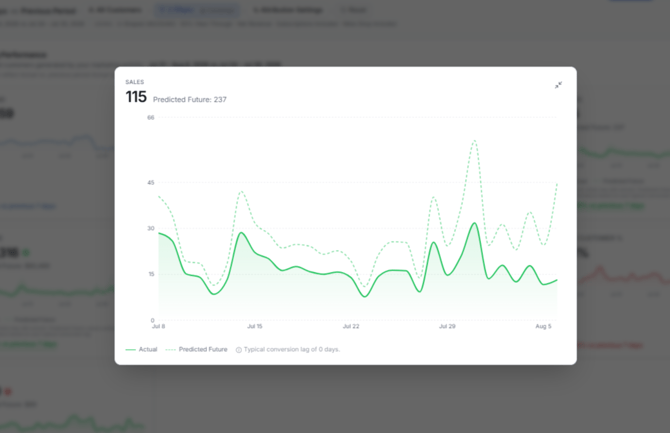
For example, a Sales card might show:
Actual Sales: 115
Predicted Future Sales: 237
The predicted value helps estimate where the marketing activity is likely to finish after its conversion lag has matured. It's important to remember that for clicks from the last 14 days have clicks which have been "working" for 13 days and clicks that have only been "working" for one day.
Predictions will also affect calculated metrics such as Revenue, ROAS, New Customers, and nCAC.
As actual conversions occur, the report becomes increasingly based on observed results rather than predictions.
Attribution Settings
Attribution Settings control how Wicked Reports calculates attribution for the current report.
Filters determine what data is shown. Attribution Settings determine how that data is calculated.
You can configure settings such as Attribution Model, View-Through Confidence, Meta Shop Purchases, Recurring Subscriptions, Revenue Type, and Custom Conversions.
See Attribution Settings in Wicked 2.0 for details.
For guidance on choosing between U-Shaped, First Click, Last Click, and Linear, see Attribution Models in Wicked 2.0: First Click, Last Click, U-Shaped, and Linear.
Attribution Breakdown
What It Answers
Which marketing activity generated my attributed results?
Attribution Breakdown is the primary drill-down analysis within the Attribution Report.
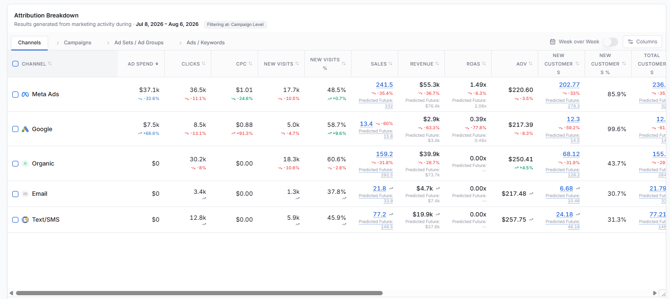
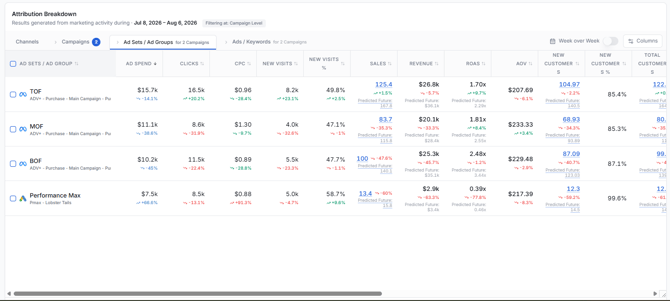
It allows you to move from a high-level channel view into increasingly detailed marketing activity.
Attribution Hierarchy
Navigate through:
Channels → Campaigns → Ad Sets / Ad Groups → Ads / Keywords
Channels
Start here to compare your major marketing sources.
This is generally the best level for identifying where changes in overall marketing performance originated.
Campaigns
Move to Campaigns to identify which campaigns within your marketing channels are driving performance.
Ad Sets / Ad Groups
Drill deeper to evaluate the targeting or organizational layer beneath individual campaigns.
Because advertising platforms use different terminology, Wicked Reports combines Ad Sets and Ad Groups into a common reporting level.
Ads / Keywords
Use the lowest level to evaluate individual creatives, ads, or keywords.
This is particularly useful for detailed media buying and optimization decisions.
Attribution Breakdown Metrics
Available columns can include metrics such as:
- Ad Spend
- Clicks
- CPC
- New Visits
- New Visits %
- Sales
- Revenue
- ROAS
- Average Order Value
- New Customers
- New Customer %
- Total Customers
- Multiple Conversion Rate metric
- Custom Conversion metrics
- and More
Metrics affected by conversion lag (Sales, Revenue, Customers, etc) will display Actual and Predicted Future values directly within the table.
Sorting
Select a column heading to sort the report by that metric.
For example:
- Sort by Revenue to find the largest revenue contributors.
- Sort by ROAS to compare marketing efficiency.
- Sort by Ad Spend to see where budget is concentrated.
- Sort by New Customers to identify acquisition drivers.
- Sort by NCAC to compare customer acquisition efficiency.
Columns
Select Columns to choose which metrics appear in the Attribution Breakdown.
This lets you configure the grid around the analysis you are performing.
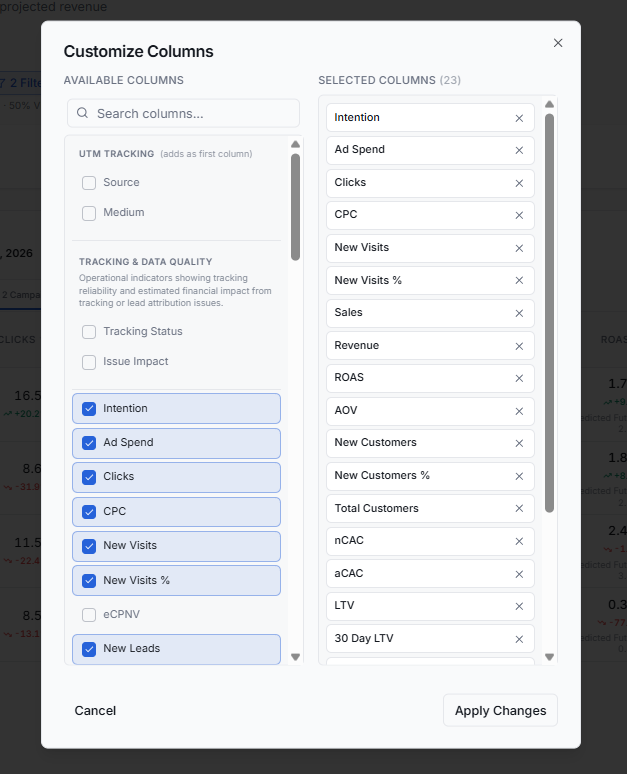
Day Over Day, Week over Week and Month over Month Breakdown Period
Use Day Over Day, Week over Week and Month over Month to expand each row and see how its metrics changed throughout the selected report period.
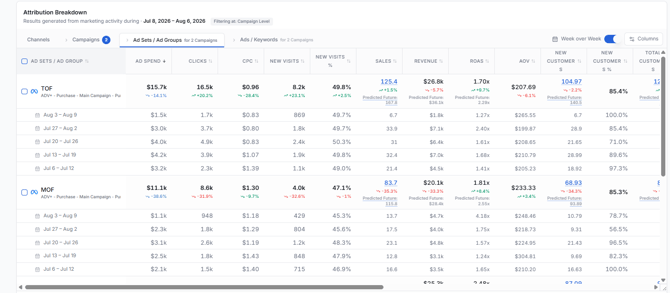
The time interval automatically adjusts based on the length of your selected date range.
Depending on the date range, Wicked Reports displays the underlying performance:
- Day by day (less than a 14 day date range)
- Week by week (14 days to 60 days)
- Month by month (more than 60 days)
For example, when viewing a short date range, expanding Meta Ads may display an individual row for each day beneath the channel total.
This allows you to identify when a performance change occurred rather than only seeing the aggregate result for the entire period.
Use this view when you want to investigate questions such as:
- When did ROAS begin declining?
- Was a revenue increase concentrated on specific days?
- Did spend increase before performance changed?
- Is an overall trend consistent or driven by a small number of periods?
Recommended Attribution Workflow
If you're unsure where to begin, work from the top of the report downward.
1. Review Business Snapshot
Understand what happened to the business.
Did revenue increase? Did sales change? Did new customer acquisition improve?
2. Review Marketing Performance
Determine how marketing performed during the same period.
Review spend, attributed revenue, ROAS, customers, and acquisition efficiency.
3. Compare Channels
Use Attribution Breakdown at the Channel level to identify which marketing sources contributed most to the result.
4. Drill Down
Move through:
Channel → Campaign → Ad Set / Ad Group → Ad / Keyword
to find the specific marketing activity driving the change.
5. Look at Performance Over Time
Use Day Over Day to determine when the change occurred and whether the overall result represents a consistent trend or a short-term spike.
6. Apply Filters
Narrow the report to the specific marketing activity you want to investigate.
FAQ
Why doesn't Wicked Reports revenue match the revenue shown in my ad platforms?
Individual advertising platforms use their own attribution methodologies. This can result in multiple platforms claiming credit for the same customer or purchase.
Wicked Reports applies a consistent attribution methodology across your marketing channels so they can be evaluated using the same measurement framework.
Why doesn't Marketing Performance Revenue match Business Snapshot Revenue?They answer different questions.
Business Snapshot Revenue represents overall business revenue during the selected date range.
Marketing Performance Revenue represents revenue attributed to the marketing activity currently included in the report.
The two values are not expected to necessarily match.
Why does performance include predicted results?
Customers often convert days or weeks after interacting with marketing.
Using only conversions that have already occurred could make recent marketing appear artificially weak.
Predicted Future values estimate the additional results expected as customers continue through their conversion journey.
Will predicted results change?
Yes.
Predictions are estimates based on the information currently available.
As customers convert and actual results become available, predicted performance is progressively replaced by observed performance.
Should I use Actual or Predicted Future results when making decisions?
Use both in context.
Actual results tell you what has already happened.
Predicted Future results help estimate how recent marketing is likely to perform after customers have had sufficient time to convert.
For older, mature marketing activity, actual results become increasingly important. For recent marketing activity, predictions provide important context and can help prevent premature optimization decisions.
Where should I start when performance changes?
Start with the Channel level of Attribution Breakdown.
Identify which channels contributed most to the change and then drill down through:
Campaign → Ad Set / Ad Group → Ad / Keyword
Use Day Over Day to determine when the change occurred and Ask AI to help identify patterns worth investigating.
What is the difference between Pulse and the Attribution Report?
Pulse is designed to quickly show how your business and marketing are performing and surface areas that deserve attention.
Attribution Report is designed for deeper investigation into marketing performance.
A common workflow is:
Pulse identifies something worth investigating → Attribution Report helps you determine what caused it.
Why are the results in the Attribution Report different from FunnelVision?
The Attribution Report is the next generation of Wicked Reports attribution reporting and is designed to replace the primary analysis customers previously performed in FunnelVision.
FunnelVision focused heavily on reconstructing customer journeys and showing how marketing interactions appeared along the path to purchase. We found that the more important question for day-to-day marketing decisions is:
How did my marketing clicks perform, and how are they expected to perform as more customers convert?
The Attribution Report was rebuilt around that question.
Instead of requiring you to interpret individual customer journeys, the Attribution Report organizes performance around the marketing activity you're actually managing — Channels, Campaigns, Ad Sets / Ad Groups, and Ads / Keywords.
It also incorporates Wicked Reports' conversion-lag predictions, allowing you to see both what your marketing has generated so far and what recent marketing activity is predicted to generate as additional customers convert.
Because Attribution Report and FunnelVision organize and calculate marketing performance differently, you should not expect every value in the two reports to match.
For ongoing marketing performance analysis, we recommend using the Attribution Report. It represents Wicked Reports' current approach to attribution analysis and is designed to provide a more actionable view of how your marketing performed — and, for recent activity, how it is expected to perform as conversion data matures.