- Why You Need This
- VIDEO: Wicked Quick Win - Getting the High Level Performance View with Mission Control
- Wicked Charts
- Wicked Data Table & "More Channels"
- Blended ROAS and Marketing Efficiency Ratio (MER)
- Wicked Google Conversion Optimizer
- Attribution Health
- Journey To First Purchase
- FAQ
Why You Need This
Wicked Reports Mission Control dashboard gives you an overall picture of how well your marketing strategy is performing. This dashboard will provide you with overall and channel level ROI, LTV, leads, sales, and revenue for all inbound marketing so you can understand which channels will produce the best results for you in the future. In addition, we provide Wicked Playbooks to help grow your business.
VIDEO: Wicked Quick Win - Getting the High Level Performance View with Mission Control
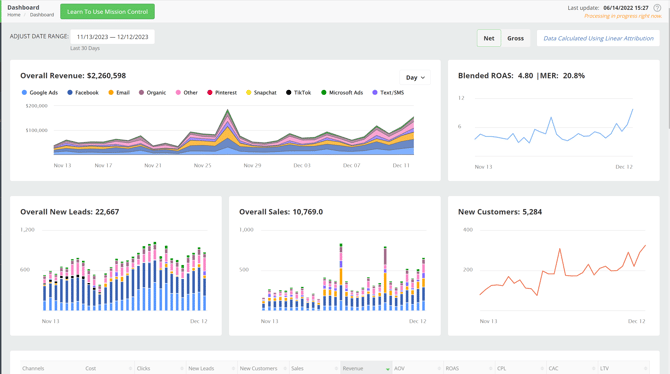
Wicked Charts
Wicked charts will show you, at a high level, how well each of the following channels are performing over the specified time period (default is 30 days):
-
- Organic
- Other (other channels/sources you may be tracking)
You are able to see your Overall Revenue, New Leads, Sales, New Customers and Blended ROAS and MER. In addition, in the upper right hand corner of the Overall Revenue chart, you can select how you want to view your data. You are able to view your data on a daily basis, weekly basis or monthly basis. By choosing one of these options, your charts will automatically update accordingly.
You are also able to change the timeframe in which you want to view your data by selecting the date selection tool above the Overall Revenue chart:
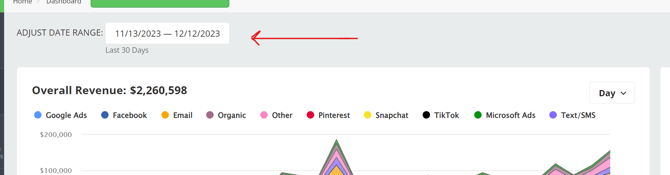
You can use one of the preselected timeframes or choose your own timeframe. After making your choice, your data will be presented to you.
Note 1: The Mission Control dashboard defaults to NET reporting, but you are able to select GROSS.
Note 2: All data that is calculated is calculated using the 4-Point Linear Attribution Model (First Click, First Optin, ReOptin, LastClick).
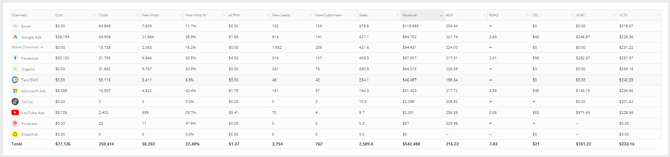
Channels Table & "More Channels"
In addition to the charts above, we provide a high-level overview of your data, in a table, broken down by channel.
Click here to learn more about how data is categorized under Wicked Reports pre-defined channels and Quick Filters (Facebook, Google, etc.)
What is "More Channels"?
Furthermore, you can click on More Channels to see additional channels which have provided you with revenue.
The More Channels section displays your Top 5 performing channels outside of our predefined channels.
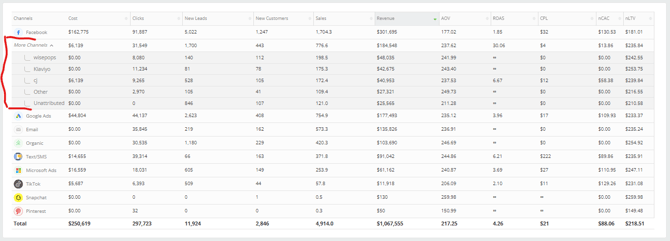
Most Common "More Channels"
Unattributed = What is Unattributed Revenue?
Pre-Wicked = What is Pre-Wicked Revenue?
Google [UTM] = Google organic search. Find more insights into this by exploring the ROI Report, then filtering by Campaign = Organic Search and Source = Google
Direct = Links that have been searched directly in the address bar, clicked on with a UTM Source of Direct, or clicked on without UTMs but contain a domain that has been placed in your account settings' Organic Domain List.
Referral = Links that have been clicked on with a UTM Campaign of Referral
exampleurl.com = Your most popular Direct or Referral URLs. Find more insights into this by exploring the ROI Report, then filtering by Source = exampleurl.com
Other = A catch-all. This is all other channels/sources you may be tracking, besides the ones listed above
How are the Totals Calculated?
Cost - Sum of all the costs across all the channels for the selected date range
Clicks - Sum of all the clicks across all the channels for the selected date range
New Visits - Sum of all the New Visits across all the channels for the selected date range
New Visits % - Total New Visits / Total Clicks across all the channels for the selected date range
eCPNV (estimated Cost Per New Visit) - Total Costs / New Visits across all the channels for the selected date range
New Leads - Sum of all the New Leads acquired across all the channels for the selected date range
New Customers - Sum of all the New Customers acquired across all the channels for the selected date range
Sales - Sum of all the sales across all the channels for the selected date range(using the Linear Attribution Model)
Revenue - Sum of all the revenue across all the channels for the selected date range
AOV - Avg. Order Value (Revenue / Sales) across all the channels for the selected date range
ROAS - Total Revenue / Total Costs across all the channels for the selected date range
CPL - Total Costs / Total New Leads across all the channels for the selected date range
nCAC - Total Costs / New Customers across all the channels for the selected date range
nLTV - Avg. Lifetime value of NEW customers acquired for the selected date range
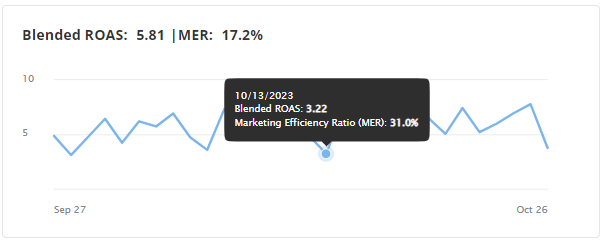
Blended ROAS and Marketing Efficiency Ratio (MER)
The Blended ROAS and Marketing Efficiency Ratio (MER) give you a high level understanding of how your business is performing by showing you how much revenue is generated overall compared to the overall costs during the same time period.
- Blended ROAS = Overall Revenue / Overall Costs
- MER = Overall Costs / Overall Revenue (as a %)
- What percentage of my revenue was came from paid media?
Wicked Google Conversion Optimizer
If you have Wicked Google Conversion Optimizer enabled, you will see the number of conversions uploaded as well as the value of those conversions for the selected timeframe (default is 30 days).
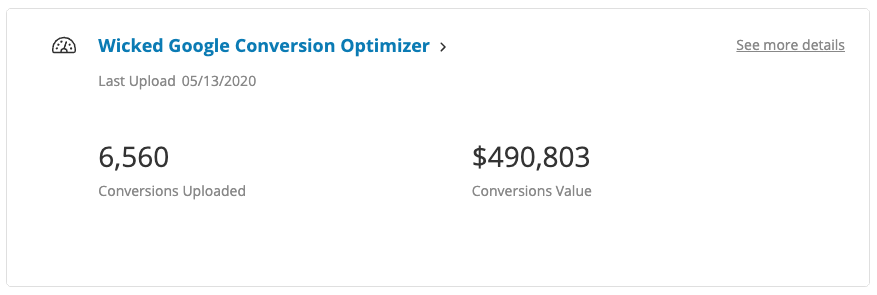
Note: If you do not have Wicked Google Conversion Optimizer enabled, you can enable it following this help doc.
Attribution Health
The attribution health indicator is a percentage of how many new orders we have attributed in the last 30 days. This percentage is useful to know as you are able to tell how well your tracking is setup. This chart will show the last 30 days of your health.
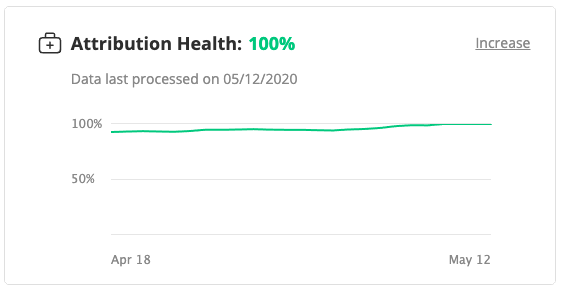
One final note. You will be able to tell when your data was last processed in this section or if it's currently being processed (see the Data last processed sentence above).
Learn more here.
Journey to First Purchase
Reverse engineer the new customer journey to their first purchase.
When Facebook is the Last Click of a new Customer's first purchase, how did you find these customers? What was their first click and how long did it take for the conversions to happen.
Discover the new customer journey from the first click as well.
When Google Non-Branded Search is the first click, on what channel do I eventually convert these new customers?
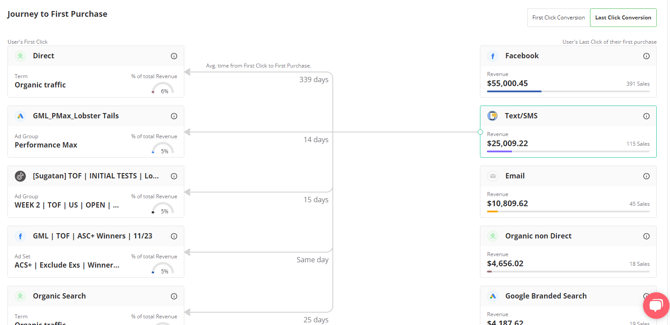
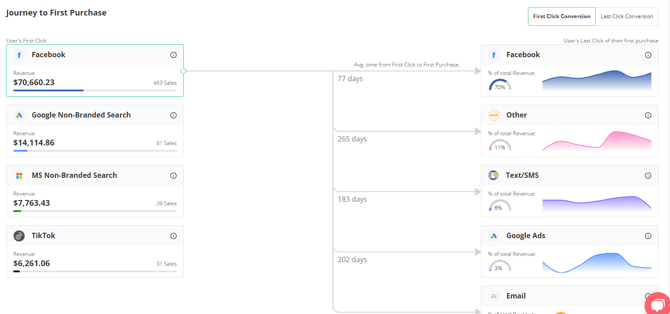
When viewing from "Last Click Conversion", the Last Click Conversion points used are
- Organic Direct
- Google Branded Search
- Microsoft Branded Search
- Text/SMS
- Organic non-Direct
When viewing from "First Click Conversion", the First Click points used are
- Google Non-Branded Search
- Microsoft Non-Branded Search
- TikTok
FAQ
- Why do the grid metrics, on my Mission Control Dashboard, look different than what is on my Funnel Vision Report?
Fundamentally, the Mission Control dashboard uses a linear attribution model, which gives equal credit to each of the four key touchpoints that lead to a conversion. While, on the other hand, the Funnel Vision Report uses a full-funnel attribution model by default, which attributes credit across all touchpoints in the customer journey. To compare these reports more precisely, you would need to use the same attribution model.