
This document is for Media Buyers, Brand Marketing Directors, and Brand Owners looking to optimize ad spend using the ROI report.
Why You Need This
Marketing attribution cuts through the noise and tells you what is working, or not working, in your marketing campaigns.
Ad platform reporting uses single-channel measurement that ignore the impact of other marketing channels and assumes credit for all conversions based on a pixel fire. All sorts of issues with this approach, here's a few reasons: (https://www.wickedreports.com/wicked-reports-vs-facebook-pixel).
Wicked Reports ROI reporting uses attribution models mapped to specific campaign goals. We only use reliable 1st party conversions detected from your CRM and Order systems.
This report will provide ROI, LTV, leads, sales, and revenue at the campaign, ad, adset, ad group, and email level for all inbound marketing.
Common Marketing Optimization Scenarios that ROI Reporting can Solve
- Unable to connect customer lifetime value to traffic sources and campaigns that convert.
- Wasting ad spend on vanity metrics that don't tie to revenue.
- You are focused on repeat buyers, subscription recurring sales via your monthly ecom boxes, or membership course subscription sales and the cost to acquire new customers is more than the 1st purchase or subscription trial month.
- Running media spend on multiple channels, plus you have a strong organic presence and consistent emailing, and can't tie it all together to get a source of truth.
Wicked Quick Wins for ROI Report
- Determining the Correct Attribution Model for a Campaign
- Optimizing marketing campaigns with Full Impact ROI Attribution
- Optimizing marketing campaigns with Last Click ROI Attribution
- Optimizing marketing campaigns with First Click ROI Attribution
- Optimizing marketing campaigns with New Lead ROI Attribution
- Optimizing marketing campaigns with Re-Engaged Lead ROI Attribution
- Optimizing marketing campaigns with Linear ROI Attribution
- Determining Kill or Chill on a Low ROI Campaign
How to use the ROI report
The ROI report uses the attribution model you select to attribute revenue to 1 or more specific conversions points in your marketing funnel. It is a huge edge to measure your marketing campaign goal with the correct marketing attribution model.
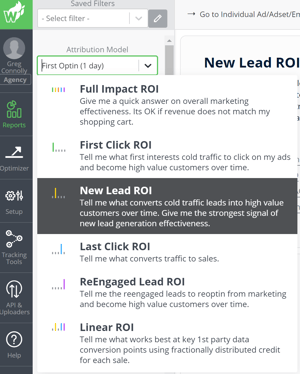 The Attribution Model Filter
The attribution model selected is vitally important. The value you choose determines which marketing touchpoints are attributed revenue.
The sales, revenue, ROI, and other metrics will change values when you change the attribution model. It is important that you understand WHY you are picking a specific attribution model, and that you assess the campaign based on the ROI according to the goal of the marketing (yes, we have models for "I didn't really have a goal").
You can see that each attribution model selection gives guidance as to the goal of that attribution model. Always keep this in mind, it is the foundation of Wicked Reports.
For more information on attribution models, see all of our articles here: https://help.wickedreports.com/attribution
Other Filter Options of Note:
- Customizing Last Click Attribution by ignoring specific clicks
- The date range filters the ad spend, clicks, leads, and sales to the date range selected.
- Quick filters will apply smart filtering to all incoming marketing traffic to save time.
- You can include or exclude certain products to see ROI for specific best sellers.
- Include Recurring Subscription Revenue
- New Subscription Payment 1 on a New Subscription
- Recurring Subscription Payment 2 - x on a Subscription. All payments after the first payment of a subscription.
- If Yes, the reports will include sales and revenue from New and Recurring subscription payments.
- If No, the reports will EXCLUDE all recurring subscription sales and payments. New Subscriptions are still included.
- Range filtering allows >,<,= filtering on the costs, leads, and new leads fields.
After selecting your attribution model and any other filters, your ROI report is generated.
The top section is the summary of all new lead-attributed costs and revenue for the time period and filters applied:

| Summary Field Name | Summary Field Description |
| Clicks | Total clicks from all traffic sources in the report filter's date range. |
| Leads | Total new leads from all traffic sources during the report data range. |
| Sales | Total sales in the report time range from new leads generated by the marketing campaign at any time prior to the last date of the report. |
| Costs | The sum of the marketing costs of all the channels for the date range selected. |
| Attributed ROI | [{(Wicked Attributed Revenue + FB View-Through Conversion Revenue)- Costs} / Costs]*100 |
| Attributed ROAS (Return On Ad Spend) |
(Wicked Attributed Revenue + FB View-Through Conversion Revenue) / Costs |
| Attribution Coverage | Attribution coverage tells you the % of orders with attribution for the attribution model selected. https://help.wickedreports.com/attribution-coverage |
| Total Revenue | Total revenue from your order system for the report filters time period. |
| Pre-Wicked Revenue | Revenue from leads that were generated before Wicked Reports. We segment them out since they are properly not attributed to any other source. https://help.wickedreports.com/pre-wicked-revenue If you have historical tracking data on new lead generation prior to your Wicked Reports start date, you can load it in, here's how. |
| Wicked Attributed Revenue | Wicked Attributed Revenue indicates how much revenue has been attributed under the selected attribution model. |
| Unattributed Revenue | Unattributed Revenue is the revenue that does not have attribution for the selected attribution model conversion point. https://help.wickedreports.com/unattributed-revenue |
Wicked Reports returns 19 columns of metrics to optimize on!
Here is the left-hand side of columns and metrics:
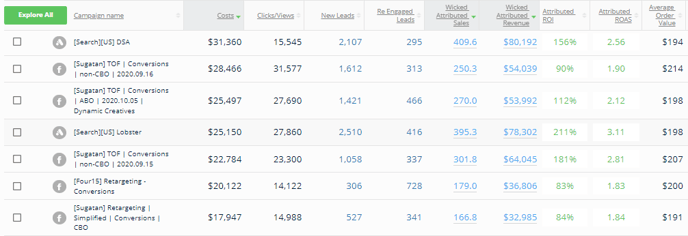
| ROI Grid Field Names & icons | ROI Grid Field Descriptions |
| The icons to the left of the campaign names are the channel/source icons. f is Facebook, A is Google Ads, etc. | |
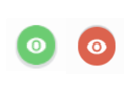 |
Eligible Google Ad campaigns will have the eyeball icon. Clicking on the icon launches the Google Campaign Optimizer screen that scales your budget based on available impressions share and projected ROI. Red Eyeball means Google Ads Impression Share is < 100% Green Eyeball means Google Ads Impression Share is 100% |
| Campaign Name | The marketing campaign name. For Facebook and Google, this is automatically detected from the ad platform. For many of our CRM email integrations, this is automatically detected and reported. For all other traffic channels/sources, this is the UTM_Source value. |
| Cost | The marketing costs for the campaign during the time period. This is automatically retrieved from Facebook and Google. Other ad platforms can use our marketing cost updater. |
| Clicks | Clicks reported by Facebook / Google, or the clicks detected by Wicked Reports tracking script. |
| New Leads | New leads attributed to this marketing campaign. |
| Re Engaged Leads | The existing leads that re-engaged with clicks and re-optins from this marketing campaign. |
| Wicked Attributed Sales | The sales are attributed according to the attribution model selected. |
| Wicked Attributed Revenue | The revenue is attributed according to the attribution model selected. |
|
Attributed ROI |
{(Wicked Attributed Revenue - Costs) / Costs}*100 |
| Attributed ROAS (Return On Ad Spend) |
(Wicked Attributed Revenue / Costs |
| Average Order Value | Wicked Attributed Revenue / Attributed Sales |
Here is the right-hand set of columns on the ROI report

| ROI Grid Field Names & icons | ROI Grid Field Descriptions |
| CPC | Cost per click = cost/clicks |
| EPC | Earnings per click = revenue/clicks |
|
CPL |
Cost per lead = cost / new leads |
| EPL | Earnings per lead = revenue / new leads |
| aLTV | Lifetime Value is the average lifetime value of all customers who made a purchase during the selected date range |
| nLTV | New Customer Lifetime Value is the average lifetime value of all NEW customers who made their first purchase during the selected date range |
| nCAC | New Customer Acquisition Cost = Cost / New Customer |
| aCAC |
The cost to acquire any customer for this campaign. Cost / All customer count |
| New Customer Count | All new customers, within the date range selected, who are attributed to the selected attribution model's touchpoints |
| Repeat Customer Count | A repeat customer who buys multiple times within the selected date range, attributed to the selected attribution model's touchpoints. Note: A New Customer with a first purchase and repeat purchases, in the selected date range, will be excluded. |
| All Customer Count | All customers, new and repeat attributed to the selected attribution model's touchpoints. |
| First Click Date | The first data that Wicked's tracking script has tracked a click. |
At this point, you have the data you need to make decisions based on ROI, LTV, and reliable, verifiable conversion data.
- Scale ad spend when the ROI is favorable.
- Chill ad spend at the same level when the ROI is break-even and your historical trends indicate it continues to rise into the future.
- Kill ad spend when the ROI is unfavorable, tracking has been in place for an entire buying cycle, and you have other campaigns you can reallocate the budget to.
We have a lot of detailed analysis to scale, kill, and chill decision frameworks in our help docs.
Marketing Optimization Tips

Customize your Last Click Attribution by ignoring specific sets of clicks. You can choose to ignore Non-Paid clicks or you can choose to Ignore All Other clicks. This is a great way to see how any specific campaign, etc. is contributing to your sales conversions even if it is not getting Last Click Conversion credit due to email and organic clicks actually being the last click prior to sale. -> Learn more about customizing Last Click Attribution.
Google Smart Campaigns combined with the Wicked Google Conversion optimizer can sometimes scale for you on auto-pilot. If the majority of your conversions happen in less than 90 days from first click, but take multiple touchpoints, consider wiring Wicked conversions into Google -> Let Wicked & Google help you with this.
Smart filtering on the ROI report can show differences in ROI by channel, campaign, gross vs net revenue, product-specific attribution, custom conversion events back to ad spend, and hide/show subscription recurring revenue.
Always remember: Choose an attribution model based on the goal of the marketing campaign. That allows you to measure the right conversion to real revenue.
Troubleshooting
- If you do not see any leads or sales for a campaign, check the report filters against the first click date of the campaign
- If revenue does not match your order system's revenue for the day, read this: https://help.wickedreports.com/my-revenue-doesnt-match-what-im-seeing-in-my-shopping-cart.-how-do-i-find-out-why
- Wicked's conversions never match Facebook or Google's, by design.
- If your tracking seems "off", use the Tracking Page Validator - super quick way to run tests without leaving the ROI report.
- Why is my paid channel attribution different now than what it was 30 days ago?
There are many reasons this may occur. One of the main reasons is the fact that we're always trying to stitch together the most accurate customer journey possible and, as we receive new data, we're able to attribute based on more data points than what we originally received. Another reason could be due to your Net revenue changing over a period of time.