- When should I use Funnel Vision?
- How To: FunnelVision Filtering
- How To: FunnelVision Attribution Settings
- How To: FunnelVision Customized Summary Section
- How To: FunnelVision Grid
- Using Views
- Frequently Asked Questions (FAQ)

When should I use the Funnel Vision Report?
FunnelVision is the most popular report inside of Wicked Reports, 90% of your time in Wicked Reports will be spent in this report.
FunnelVision is most commonly used to review:
1. High-level, customizable performance reports that you can share with your boss or client.
2. Performance reports broken down by Strategy or Initiative so you can communicate areas of opportunity with your team.
How do I use the Funnel Vision Report?
Filters
FunnelVision allows you to filter on every available column in the FunnelVision Grid using complex And/Or with filter grouping logic.
By using Dynamic or Static date range filtering and nearly any combination of filters, you can create a report that gives you exactly what you are looking for.

Attribution Settings
Attribution Settings is how your report will be generated. FunnelVision offers a variety of Attribution Settings that will allow you to decide how your report is built. You can decide if you want to report based on conversion dates or date of when clicks occurred.
You can decide the type of attribution model you want to use and how you want revenue broken down. Do you like to use Facebook View-Through Conversions as part of your reporting or not? You have complete control of how you want your data to look.

Customized Summary Section
FunnelVision allows you to see only the top-line metrics that matter you. Maybe you need only a few metrics, maybe you need ten. It's up to you to organize your report as you need.

Grid
The FunnelVision grid allows for tons of flexibility. Add/Remove and rearrange the columns you want to see.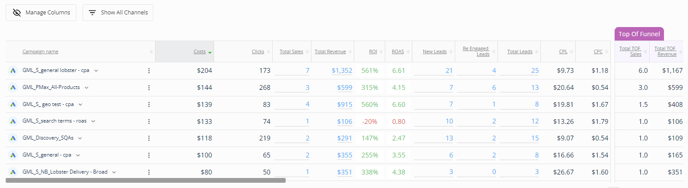

Using Views
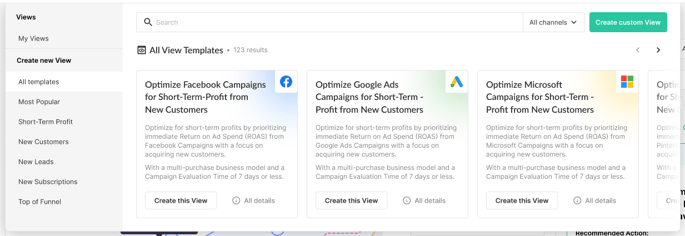
Views are the cornerstone of speeding up your data analysis within Wicked Reports. A View is a saved version of a report. Each View is a collection of saved Filters, Attribution Settings and Grid Columns.
You can create as many views as you like, either from scratch or from our helpful templates.
Views can be Pinned for easy and quick access
Frequently Asked Questions (FAQ)
- How do I make the FunnelVision Report Match the ROI Report?
FunnelVision offers Attribution Settings that will completely line up with the ROI Report.
-
- For ROI Report: First Click, you can select Report By Conversion Date and First Click Attribution Model
- For ROI Report: First Optin, you can select Report By Conversion Date and First Optin Attribution Model
- For ROI Report: Re-Optin, you can select Report By Conversion Date and Re-Optin Attribution Model
- For ROI Report: Last Click, you can select Report By Conversion Date and Last Click Attribution Model
- For ROI Report: Full Impact, you can select Report By Conversion Date, all four Attribution Models and and Full Impact Revenue Breakdown
- For ROI Report: Linear Attribution, you can select Report By Conversion Date, all four Attribution Models and and Linear Revenue Breakdown
- When in the Overall Channel using Linear Revenue Breakdown, why doesn't my Total Revenue equal the sum of the rows for Total Revenue column?
This is because we do not show unattributed revenue in the FunnelVision grid. Hover over the Total Revenue in the summary section and you will see how much revenue is shown as unattributed. The sum of Total Revenue column in the grid should match what the Tool-Tip shows as Attributed Revenue.
- How do I see my results based on when clicks happened, rather than when conversions happened?
FunnelVision offers an Attribution Setting to Report By Click Date which will first find all the clicks that occurred during a selected date range and then report on ONLY the sales that came from those clicks. Click Date mode will ignore any sale that occurred in the selected Date Range, but did not also receive a click in the same date range.
- Why does New Customer Cohort not match FunnelVision New Customers (within a channel)?
For any given channel, unless you have selected all attribution models, the amount of sales (and customers) is calculated differently, as mentioned above. Cohort is using ROI style (First Click First Optin, Last Click and Re-Optin). To make them match as close as possible, you will need to select all 4 main attribution models in your FunnelVision attribution settings.
- Can a lead, in the "Leads" summary section, be both a new and a re-engaged lead within the same date range?
Yes. A lead can be both a New Lead and a Re-Engaged lead during the same date range. That indicates that the lead first joined during this date range, then they re-opted in at some point during this same date range.
- Why doesn't the Facebook Columns data match what I see in Facebook?
Facebook columns are pulled in once daily. This means that are NOT live. Be sure to NOT include today, in your Facebook date range.
Also be aware that when the Facebook data columns were added to Wicked Reports, only 30 days worth of data was imported. So, if you are going back before May 2023, the data may not be complete. Note: If you need more data imported, please contact support and they can help you get more Facebook data into your Wicked Reports account
- How do I compare two date ranges?
To compare multiple date ranges, toggle the Compare to period option in the filters and select a previous time period to compare.
-
- After you apply the changes, you will see the up/down trend for the data points.
- If you hover over the up/down trend, you will see the value from the previous period to show why the trend is up/down.
[Click Here To Learn More About Using Compare To]
- Are Saved Views unique to users?
No. Saved Views are unique to accounts.
-
- Any user can see any view on the account
- If a user changes the settings of a view, such as the order of a particular column, and saves and applies this change, then this update will apply to all users who later use that view.
- Which users show up as Pinned Views is however, unique to a User. You may have different pinned views than your coworkers on the same account.
- Why doesn't my New Customer Value Chart update when I change my filters
Ensure you have selected the "Date Range" option for the New Customer Value chart. If you have selected the "All Time" option, the Chart will not change because it does not take your filters into consideration. It simply finds all Customers for all orders imported into Wicked Reports and provides their 365 day value over time.
- For each new customer, does the All Time New Customer Value chart include all day 0 orders or just the first?
It includes all day 0 orders. The chart reflects the average LTV per customer, so all purchases made on day 0 are counted—not just the first.
- Does the All Time New Customer Value chart use net or gross revenue?
Net.
- Does the All Time New Customer Value chart include $0 orders?
No. $0 orders are excluded.
- Why is my ad missing from the Grid results?
For ads to show up in the grid, you'll need to ensure you have the correct ad account integrated. In addition, that ad will need to have costs > 0 and/or clicks > 0, along with the status of the ad set to ENABLED or PAUSED. If these conditions are not met, your ad may be missing from the grid results. However, if these ad conditions are met, then please reach out to support@wickedreports.com so that we can assist you further.
- Why are my filters not applying correctly?